Powering up on technology, localisation and globalisation
In 2024, Greater China equities closed higher due to a series of stimulus measures which catalysed the underlying structural momentums and growth trends. In this 2025 outlook, the Greater China Equities team will elaborate on four reasons for more upside potential going into 2025 despite potential US tariff concerns and geopolitical headwinds, as well as investment opportunities based on the 4As positioning for Greater China equity markets.

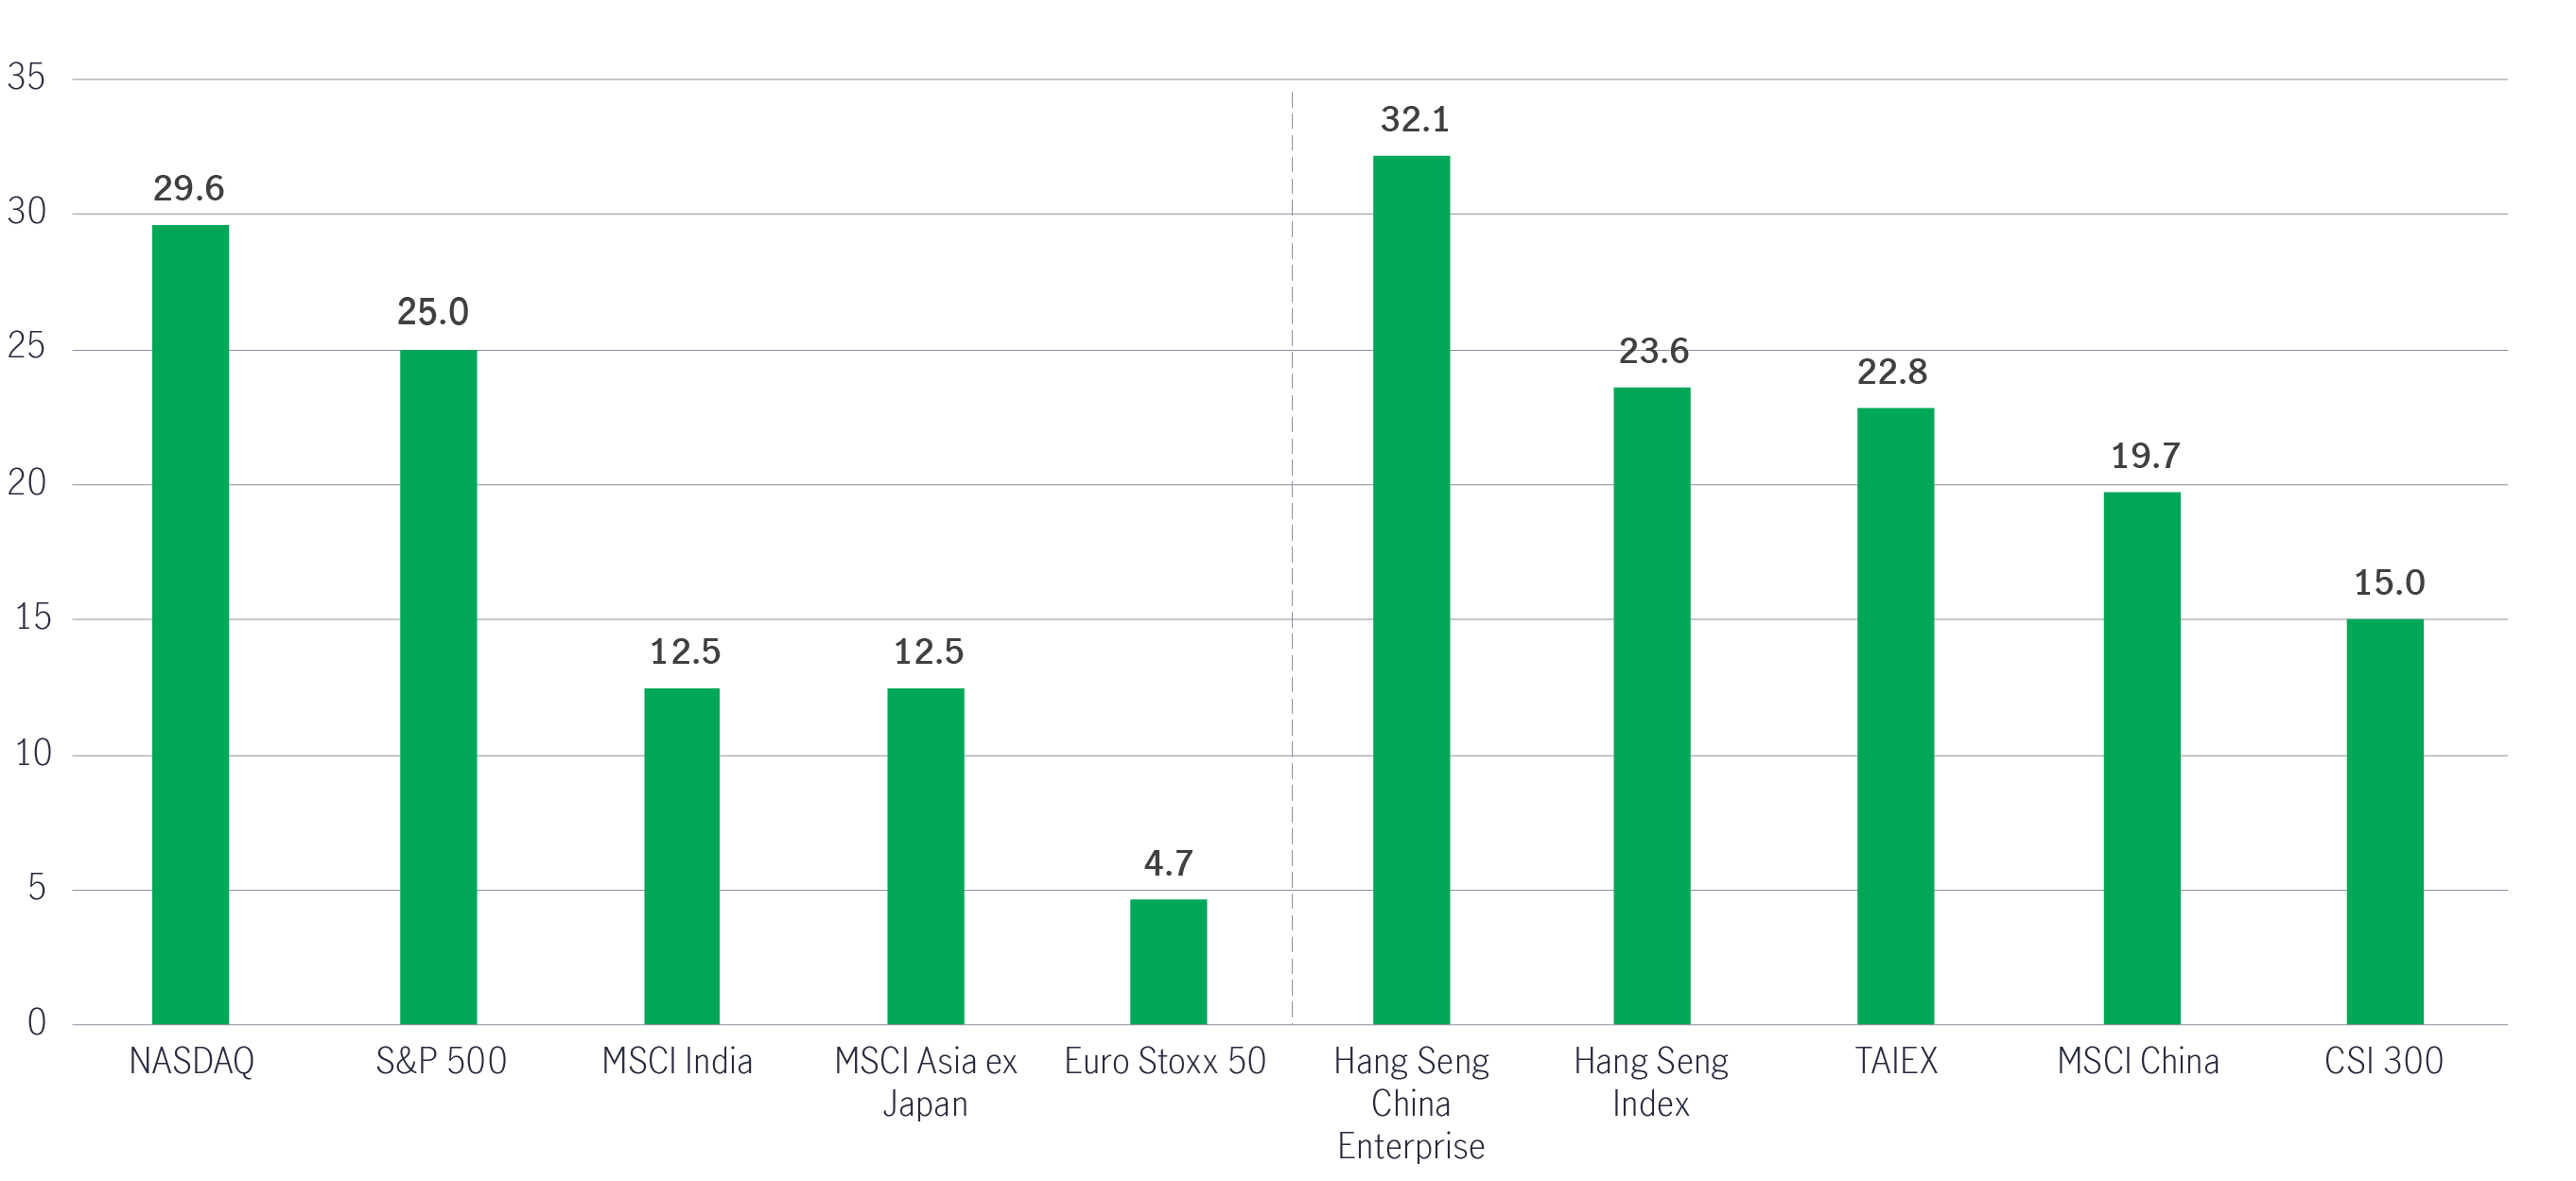
In 2024, Greater China equity markets closed higher (see Chart 1) on the back of stimulus and easing policies spanning monetary and fiscal measures, as well as the property and equity markets.
Chart 1: 2024 global equity market performance (%, in US dollar)
Despite near-term market volatility and uncertainty driven by the US and geopolitical headwinds, there are four reasons why we believe that Greater China markets have more upside potential going into 2025.
1) New fiscal policy initiatives
2) Mainland China can navigate tariff situations via different methods
3) Mainland Chinese corporates are “valuing up”
4) Mainland China/Hong Kong markets can re-rate with better fiscal policy execution
1) New fiscal policy initiatives
The Chinese government’s economic intentions have changed drastically, and its policy actions have been significantly stepped up since the end of September 2024 (see Chart 2). Previous rounds of fiscal policies were more supply-side driven versus the predominantly demand focus of this round, which is useful to drive a demand recovery. Fiscal spending is expected to increase in 2025, with augmented fiscal deficits set to rise. This will facilitate property de-stocking, which should drive a recovery in the property market. Local government debt swaps should help reduce concerns about bad debts in local government financing vehicles (LGFVs), recapitalisation should make banks stronger, and other consumption stimulus programmes will boost and stimulate consumption growth.
Chart 2: Summary of major fiscal policies
Area |
Details |
Equipment renewal
|
|
Consumer goods trade-in |
|
| Local government debt swap |
|
| Property |
|
Source: Manulife Investment Management
Furthermore, mainland China encourages parent companies to buy back shares, which is positive for the A-share equity market.
With concrete execution going into 2025, we believe mainland China’s multi-pronged, concerted approach should set the stage for a further visible economic recovery next year.
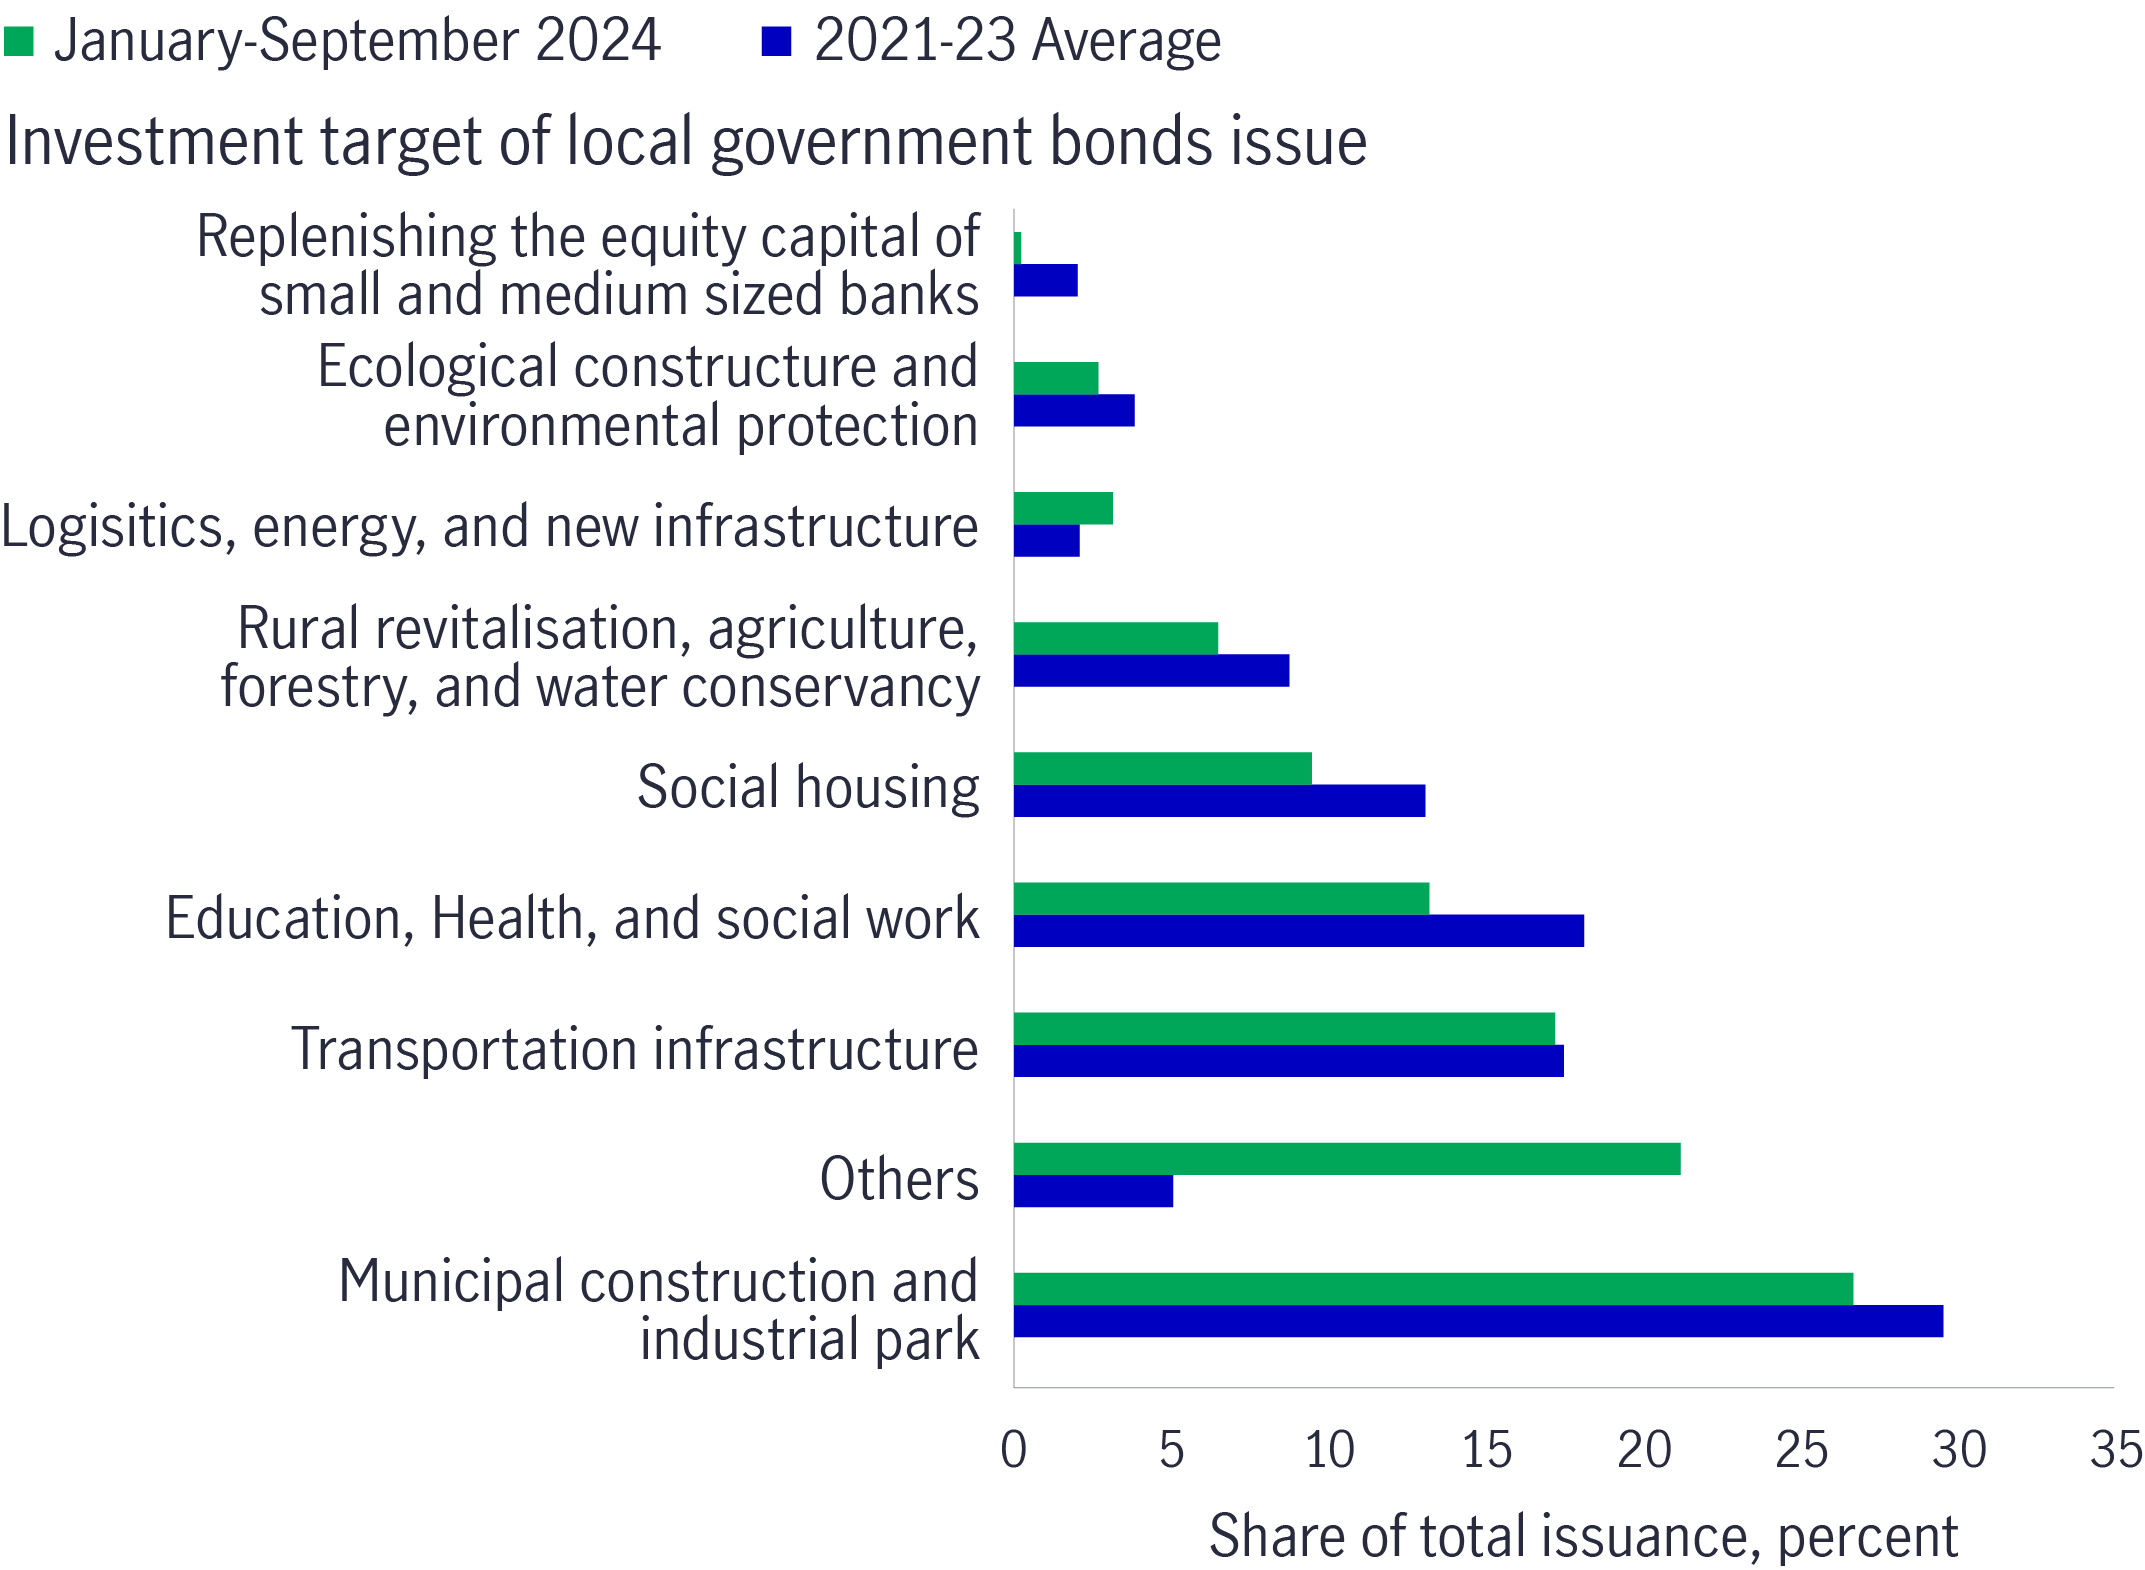
Chart 3: Local governments are increasingly spending more on logistics, energy and new infrastructure
2) Mainland China can navigate tariff situations via different methods
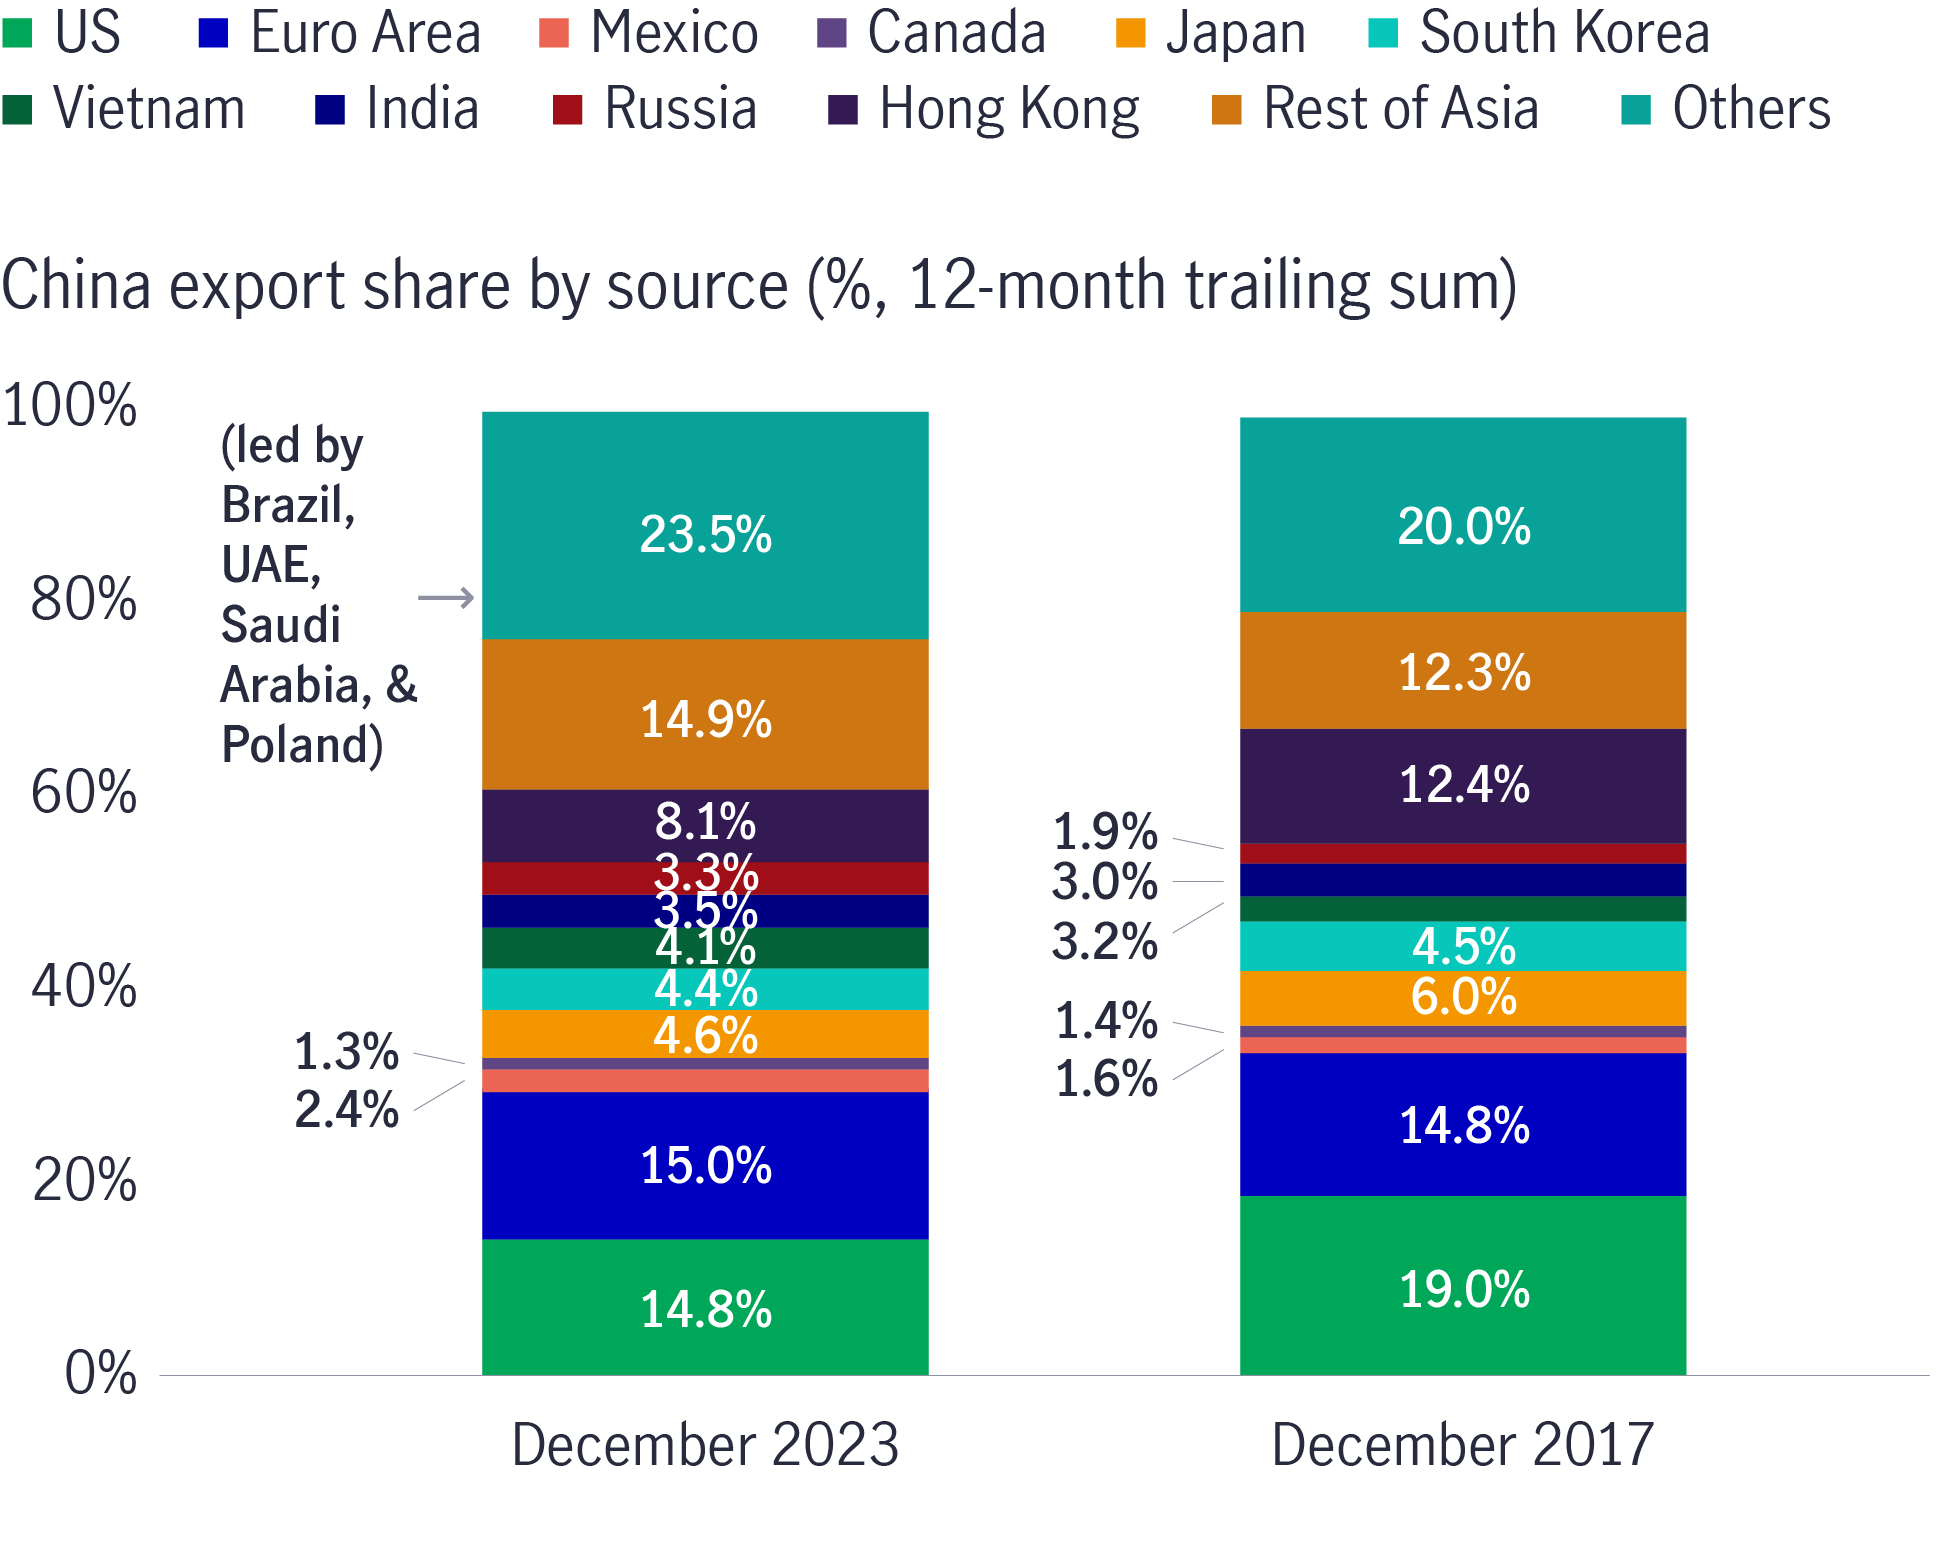
Tariff actions are not new. They were first implemented by the Trump administration in 2018. Since then, mainland China’s exports to the US have declined while exports to the rest of the world have risen. For instance, in 2017, mainland China’s exports to the US (as a percentage of its export share) stood at 19%. This figure had reduced to 14.8% by end-December 2023. Meanwhile, exports to the rest of the world rose from 20% in 2017 to 23.5% in 2023. Therefore, mainland China has effectively diversified its export destinations, especially over the past few years.
Chart 4: Mainland China has exported less to the US but more to the Euro Area, Vietnam, Mexico and the rest of Asia
Import substitution in the works
In addition, we believe that mainland China is progressing well on import substitution, another way to navigate geopolitical headwinds.
For example, in recent years, the US has announced various regulations relating to semiconductor/chip tools/artificial intelligence (AI) memory in mainland China. However, the rules have not stopped mainland China’s semiconductor industry from growing. In fact, mainland Chinese semiconductor manufacturers have accelerated their capital investments in the domestic market to mitigate export controls over the past few years. For instance, global equipment makers’ revenue exposure to mainland China increased to between 32% and 50% in the second quarter of 2024, as mainland China procured more semiconductor production equipment to localise operations.
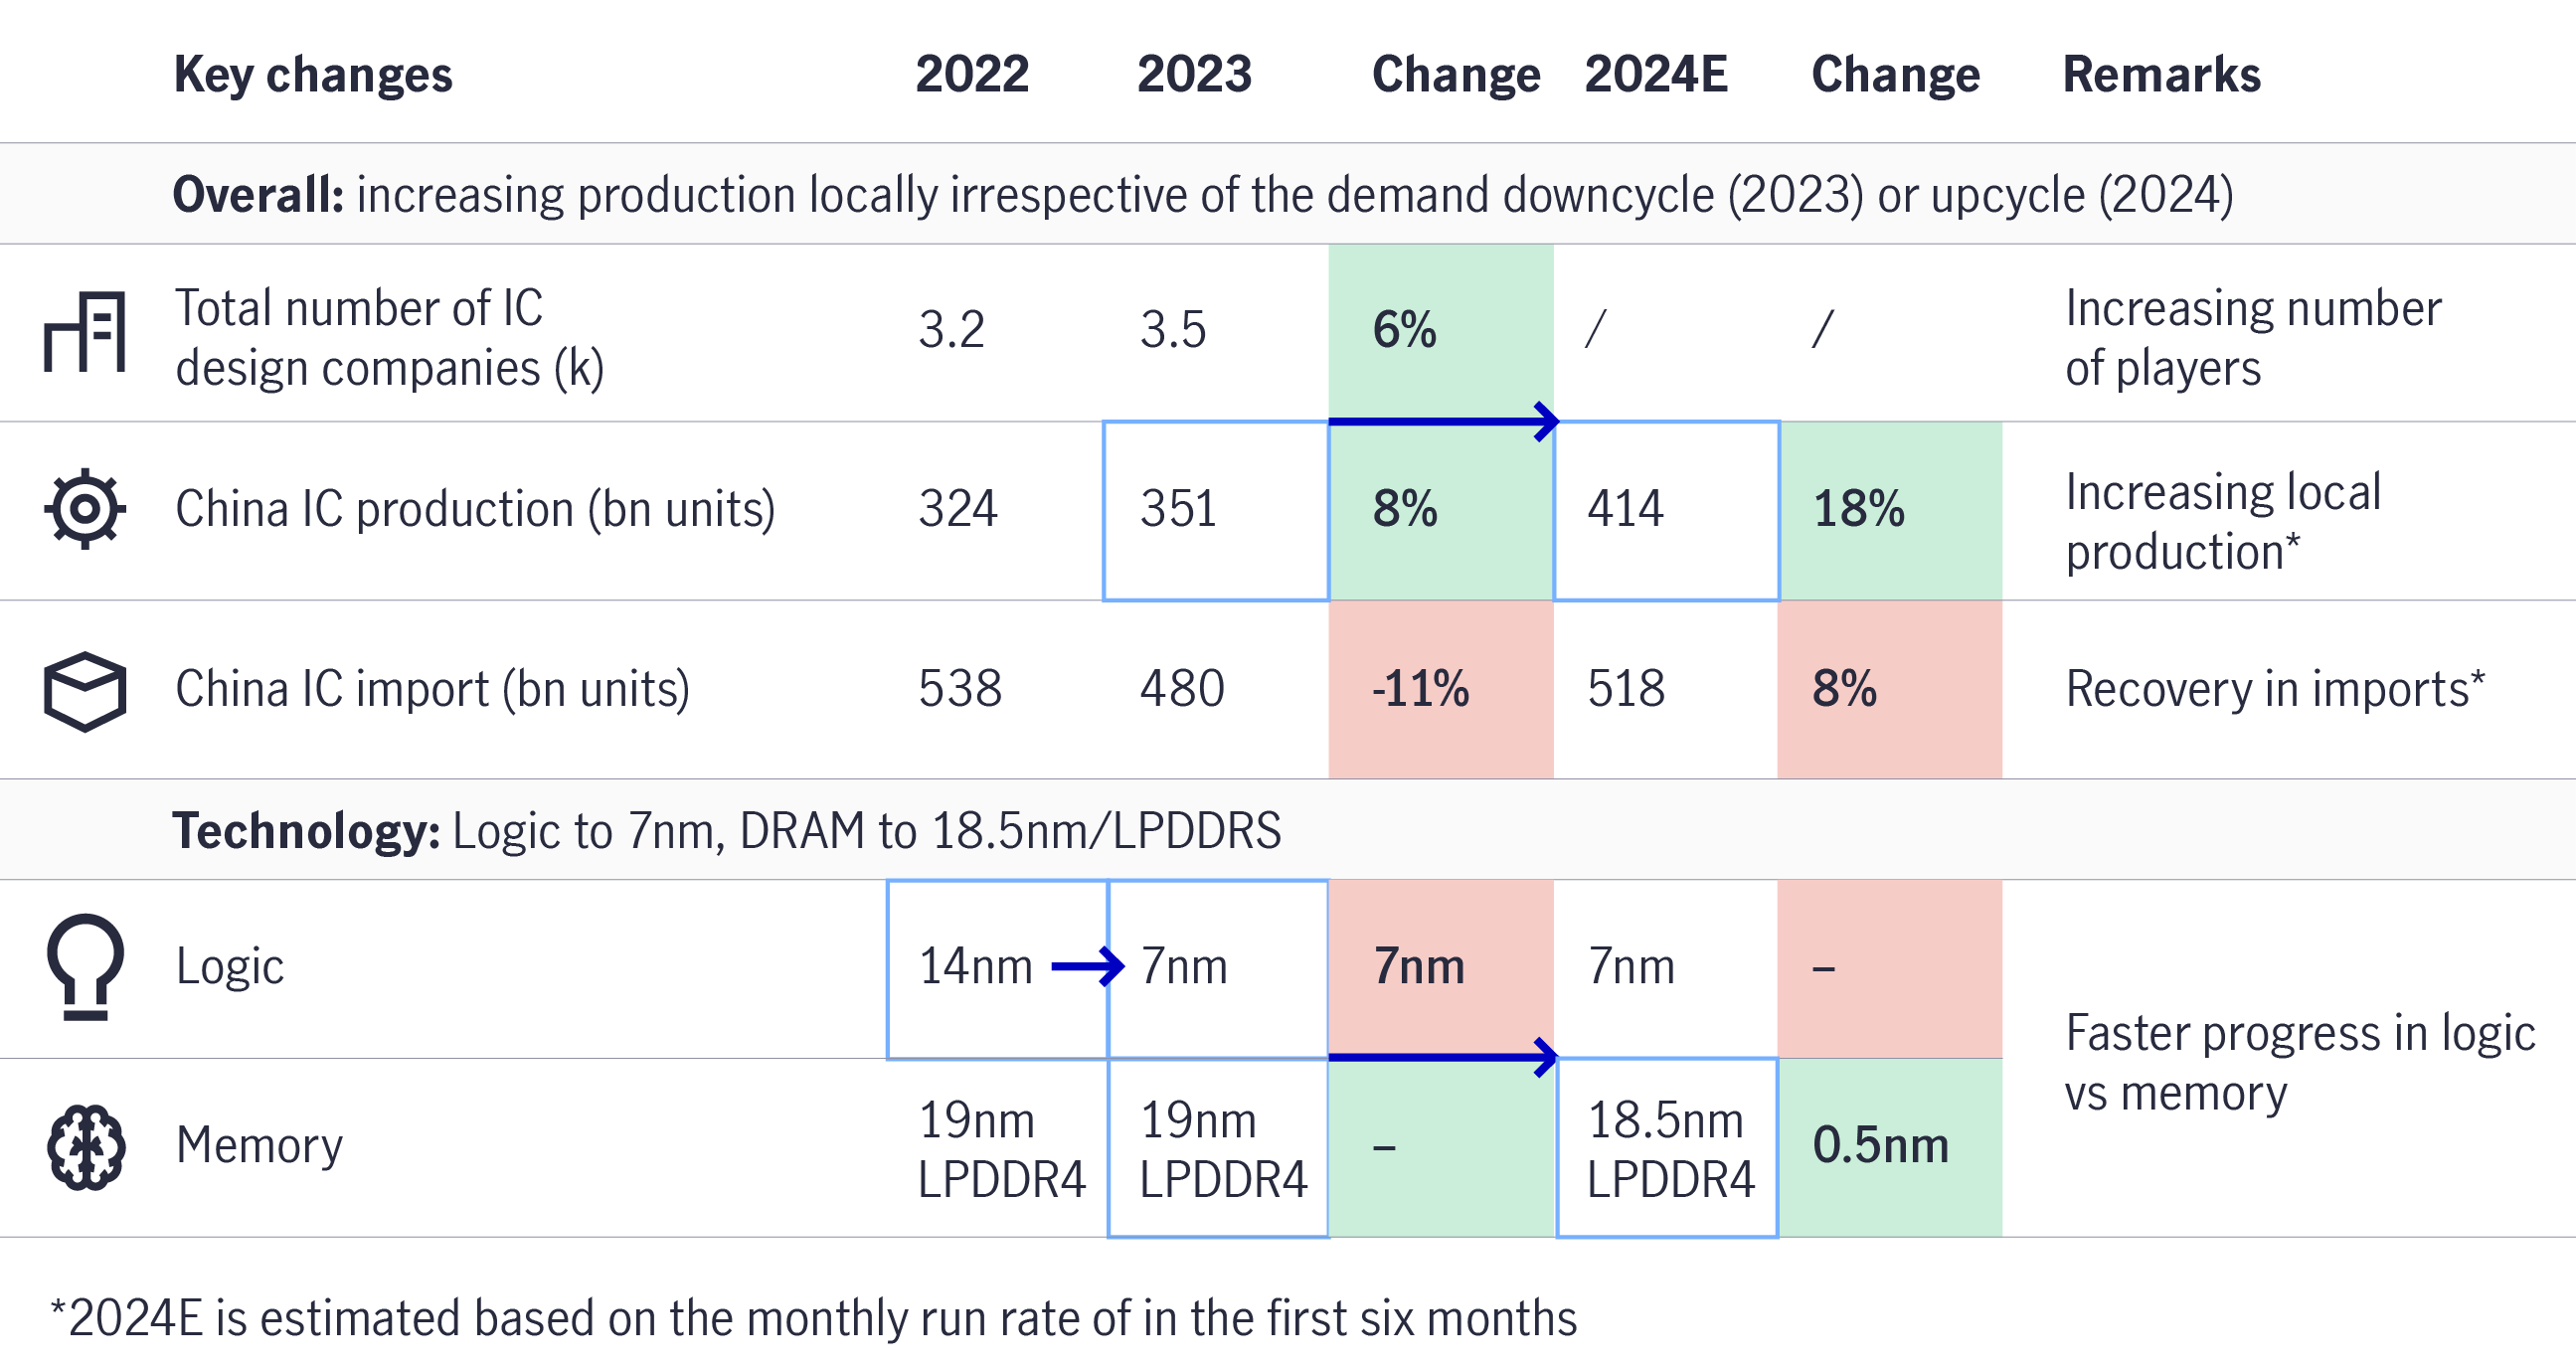
In addition, the number of integrated circuit (IC) design companies in mainland China increased from 3,200 in 2022 to 3,500 in 2023 despite the semiconductor demand downcycle in 2023. Mainland China’s IC production increased by 8% year on year (y/y) to 351 billion units in 2022-23 and may reach 414 billion units in 2024, growing at 18% y/y. The mature nodes are import substitution capable (e.g., power semis, contact image sensor (CIS), radio-frequency (RF) and deposition tools), leading to a larger domestically built percentage of the value chain despite lithography remaining a bottleneck. Furthermore, mainland China is making significant strides in logic development (from 14 nanometres to 7 nanometres) and memory development (2024E: to 18.5 nanometres low-power double data rate) (see Chart 5).
Chart 5: Mainland China accelerates on its technology roadmap
In short, mainland China is ready to strategically navigate tariff situations given its robust local and global supply chain network.
3) Mainland Chinese corporates are “valuing up”
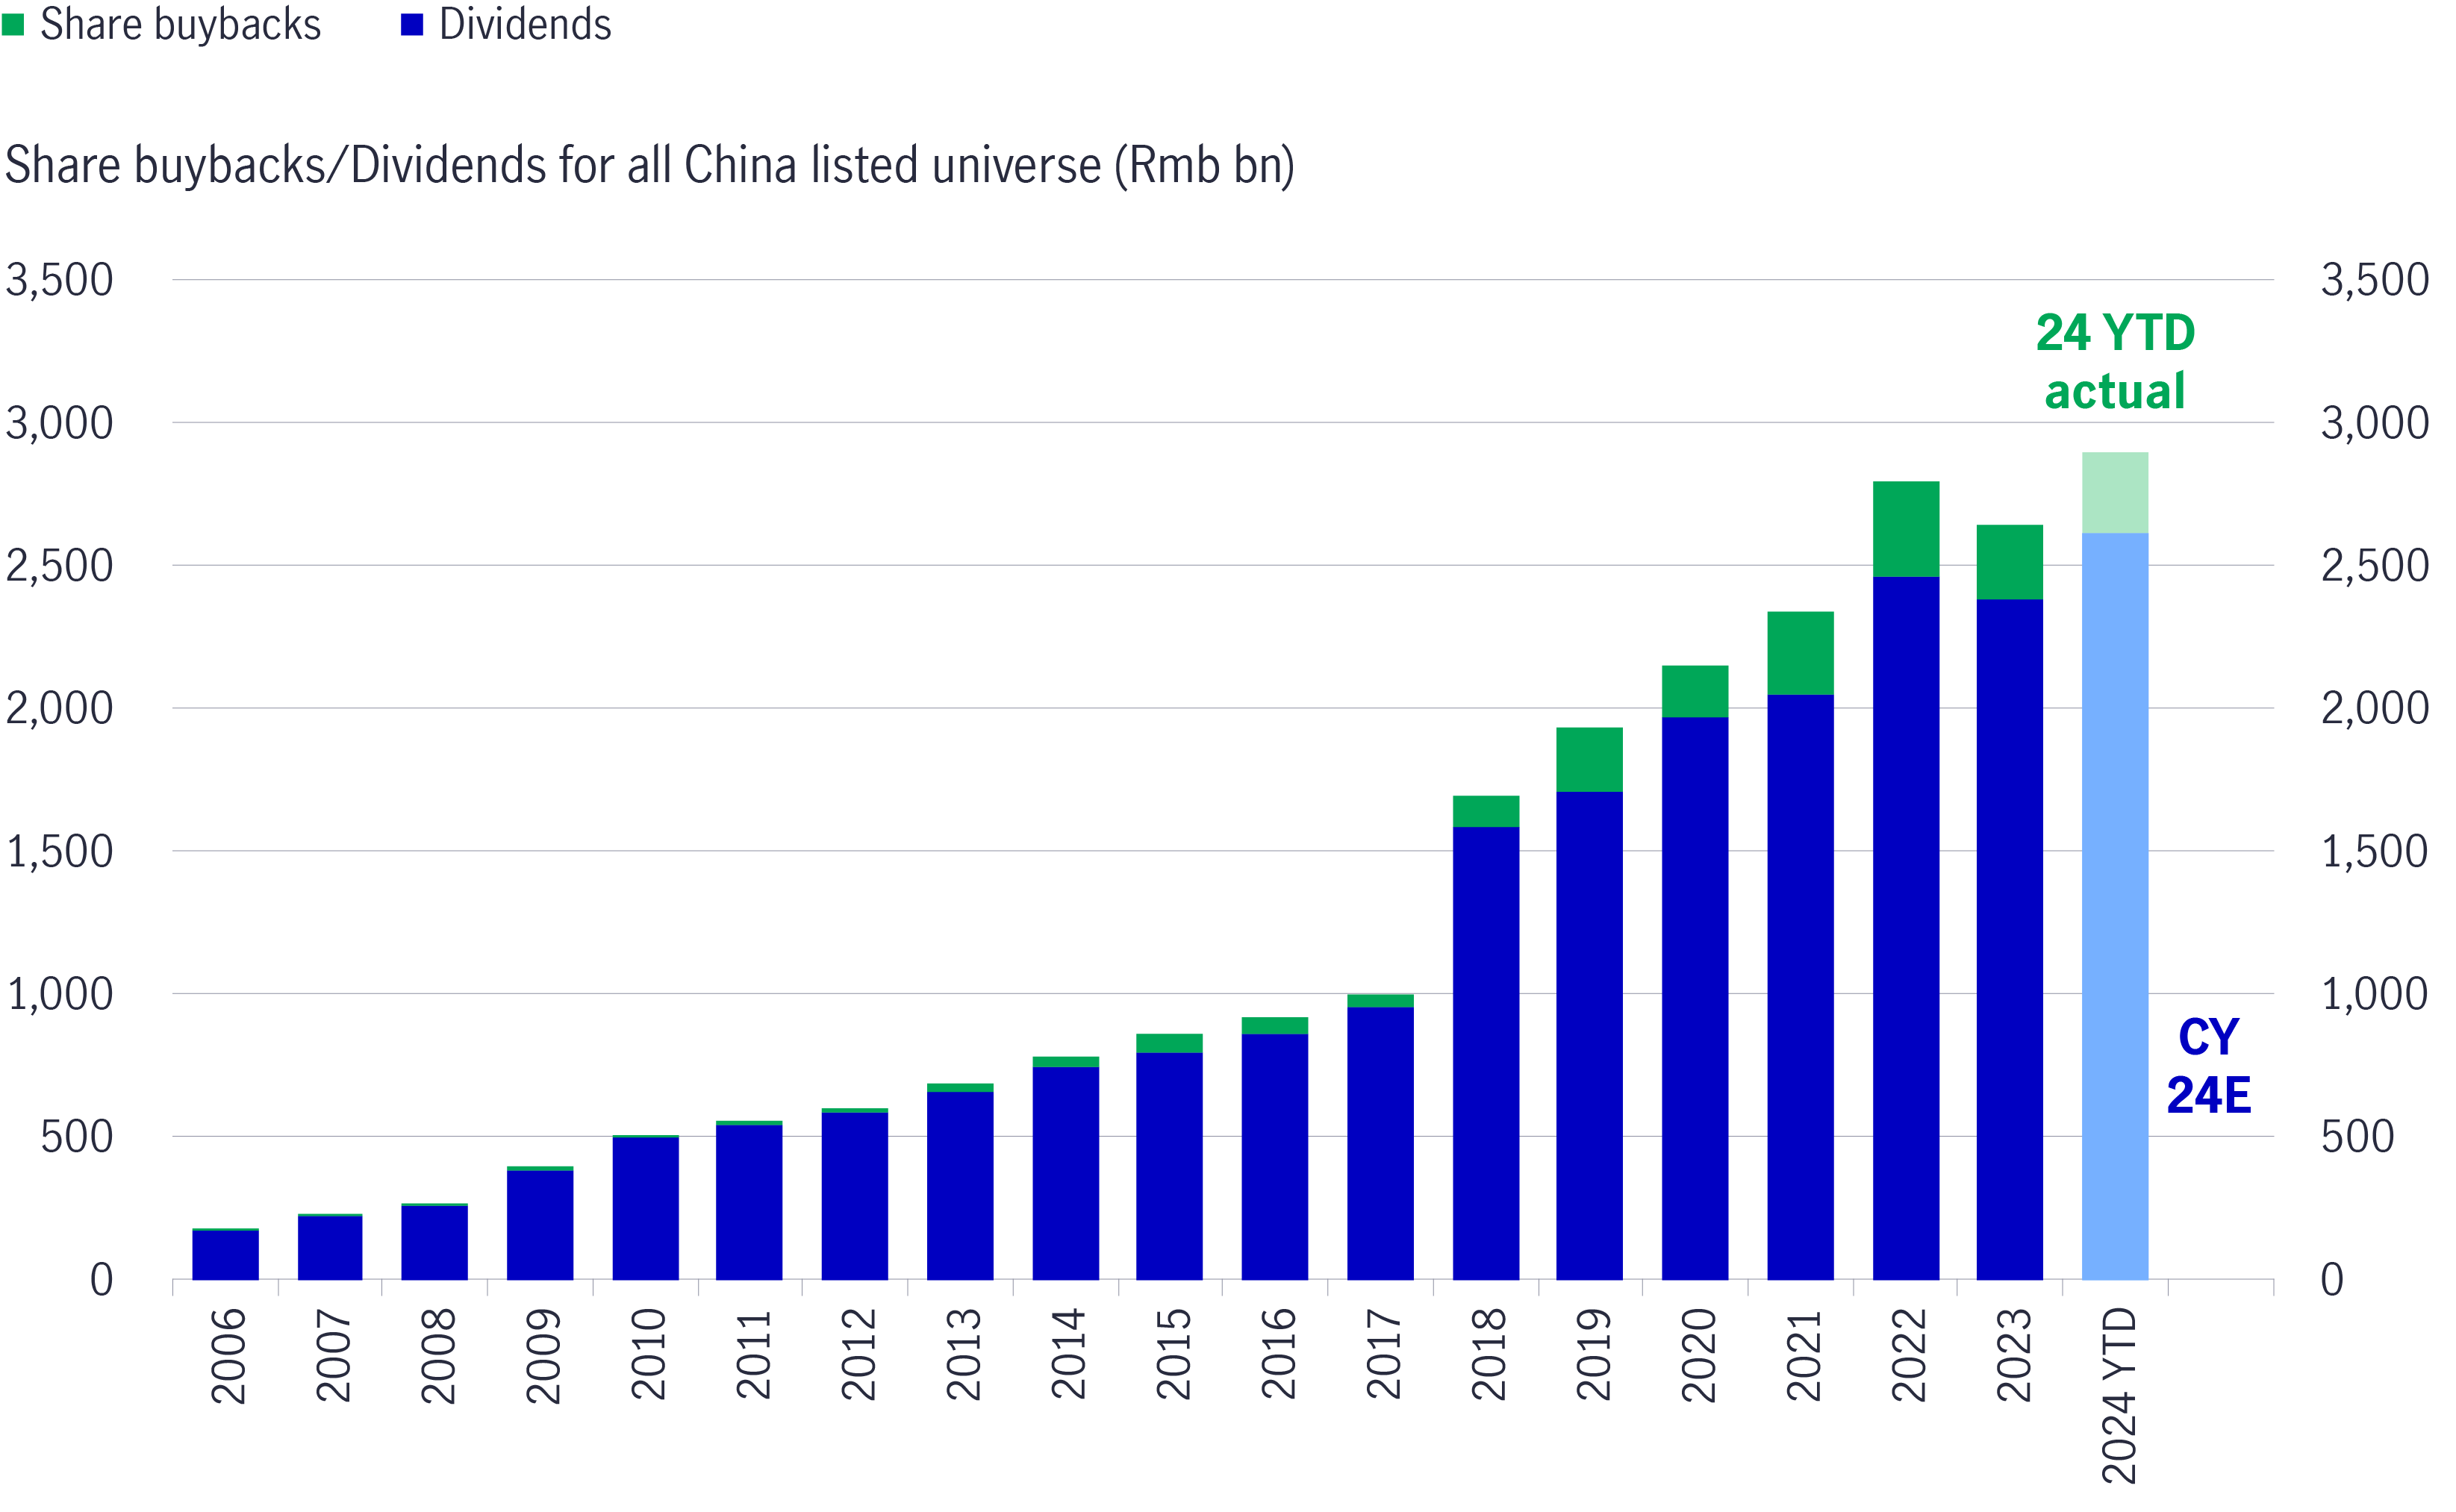
Mainland Chinese corporates are “valuing up”. During the first nine months in 2024, total dividends and buybacks are on track to reach RMB 3 trillion this year. Nearly 600 companies announced interim dividends in 2024, reaching new highs. As the Chinese government encourages companies to improve shareholder value, such moves are positive for shareholders. We favour companies with growth at a reasonable price (GARP) yield, improving earnings growth and payout ratios.
Chart 6: Total dividends and buybacks are on track to reach RMB 3 trillion in 2024
4) Mainland China/Hong Kong markets can re-rate with better fiscal policy execution
Overall, we saw some modest green shoots in the October data, which set the stage for potential growth acceleration of gross domestic product (GDP) into 2025. Following mainland China’s monetary and fiscal policy announcements, major macro data improved in October 2024. For example, the Caixin China Purchasing Managers’ Index (PMI) Manufacturing survey improved to 51.5, and the Caixin PMI Services survey improved to 51.5 in November (the second consecutive time both have been above 501 since April 2024).
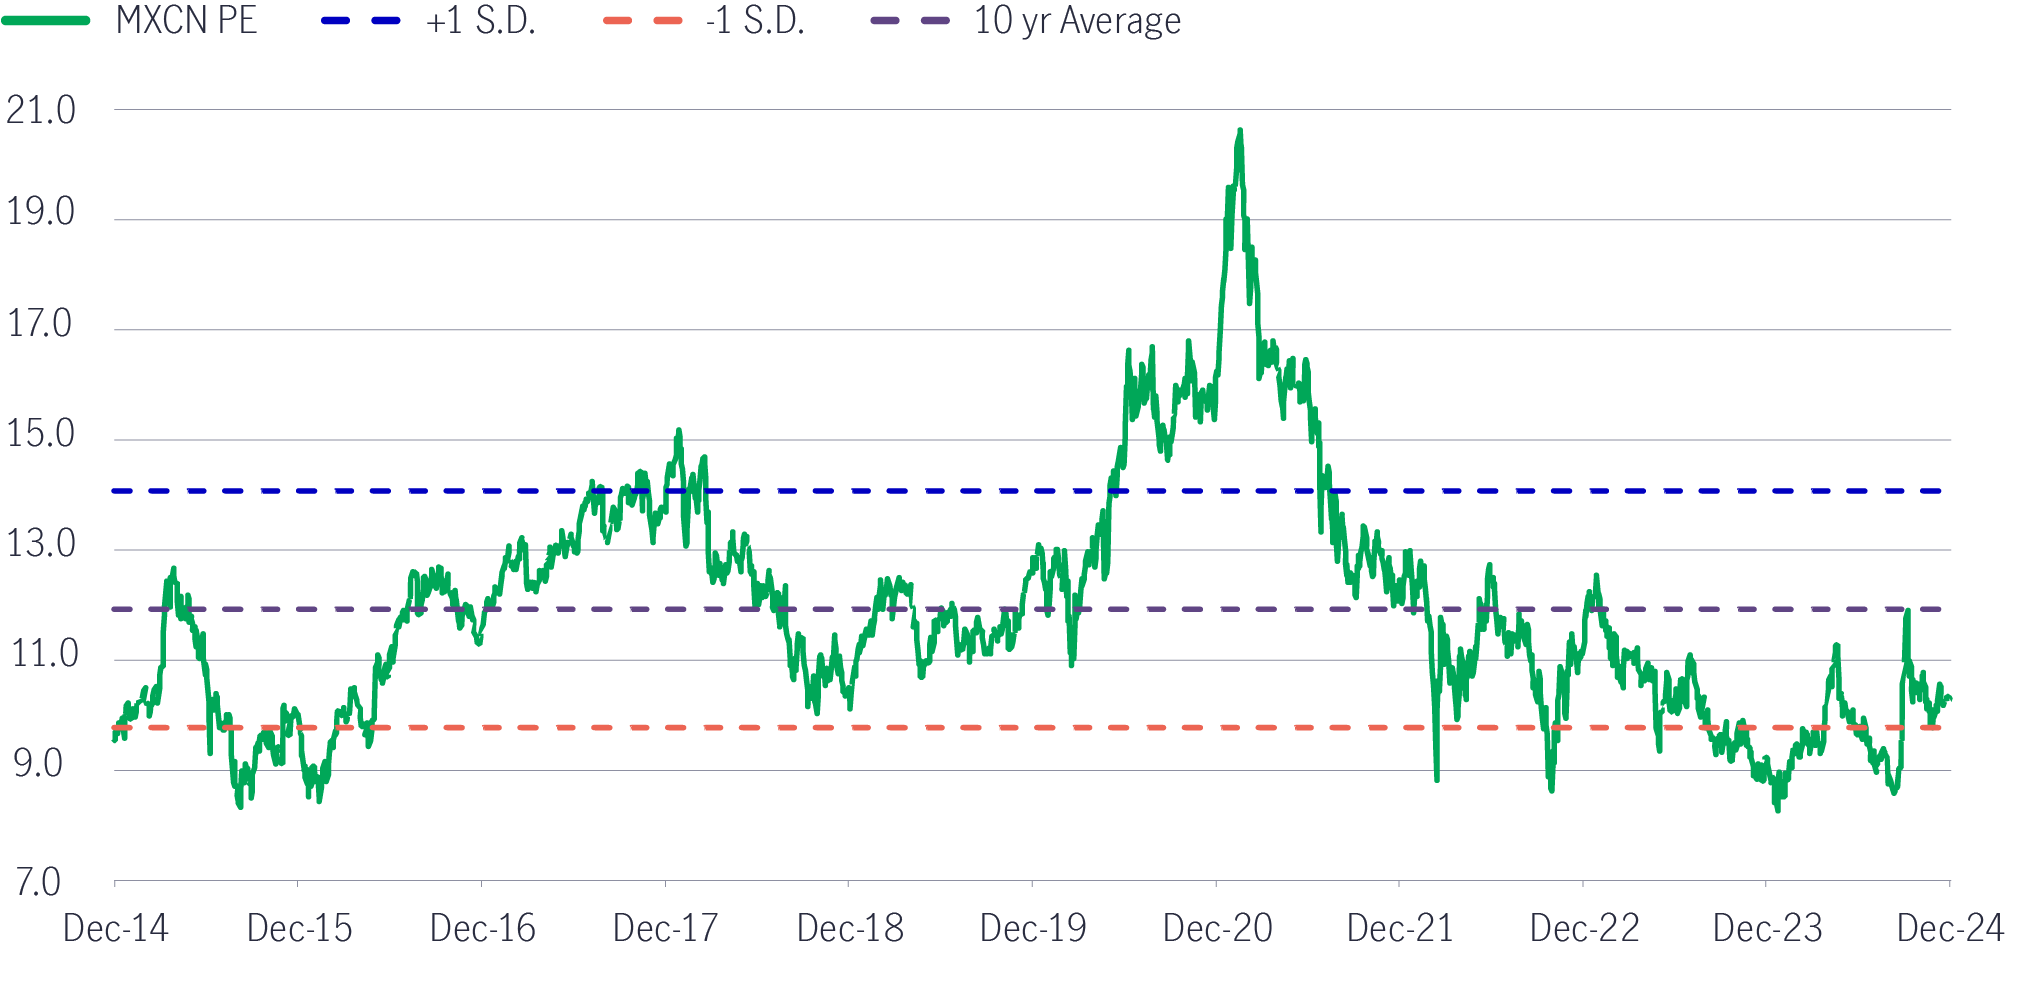
Despite mainland China/Hong Kong markets rallying by around 15-33% this year (see Chart 1), the valuation of the MSCI China index is still trading at 10.5x-11x forward price-earnings (P/E). Even though near-term earnings will likely be affected by tariff concerns, the valuation of the MSCI China index can expand with a sustainable corporate earnings recovery. For instance, if earnings growth can reach 10-15% y/y coupled with a sustained recovery, we believe it can be re-rated to 12x-15x, depending on earnings.
Our investment process
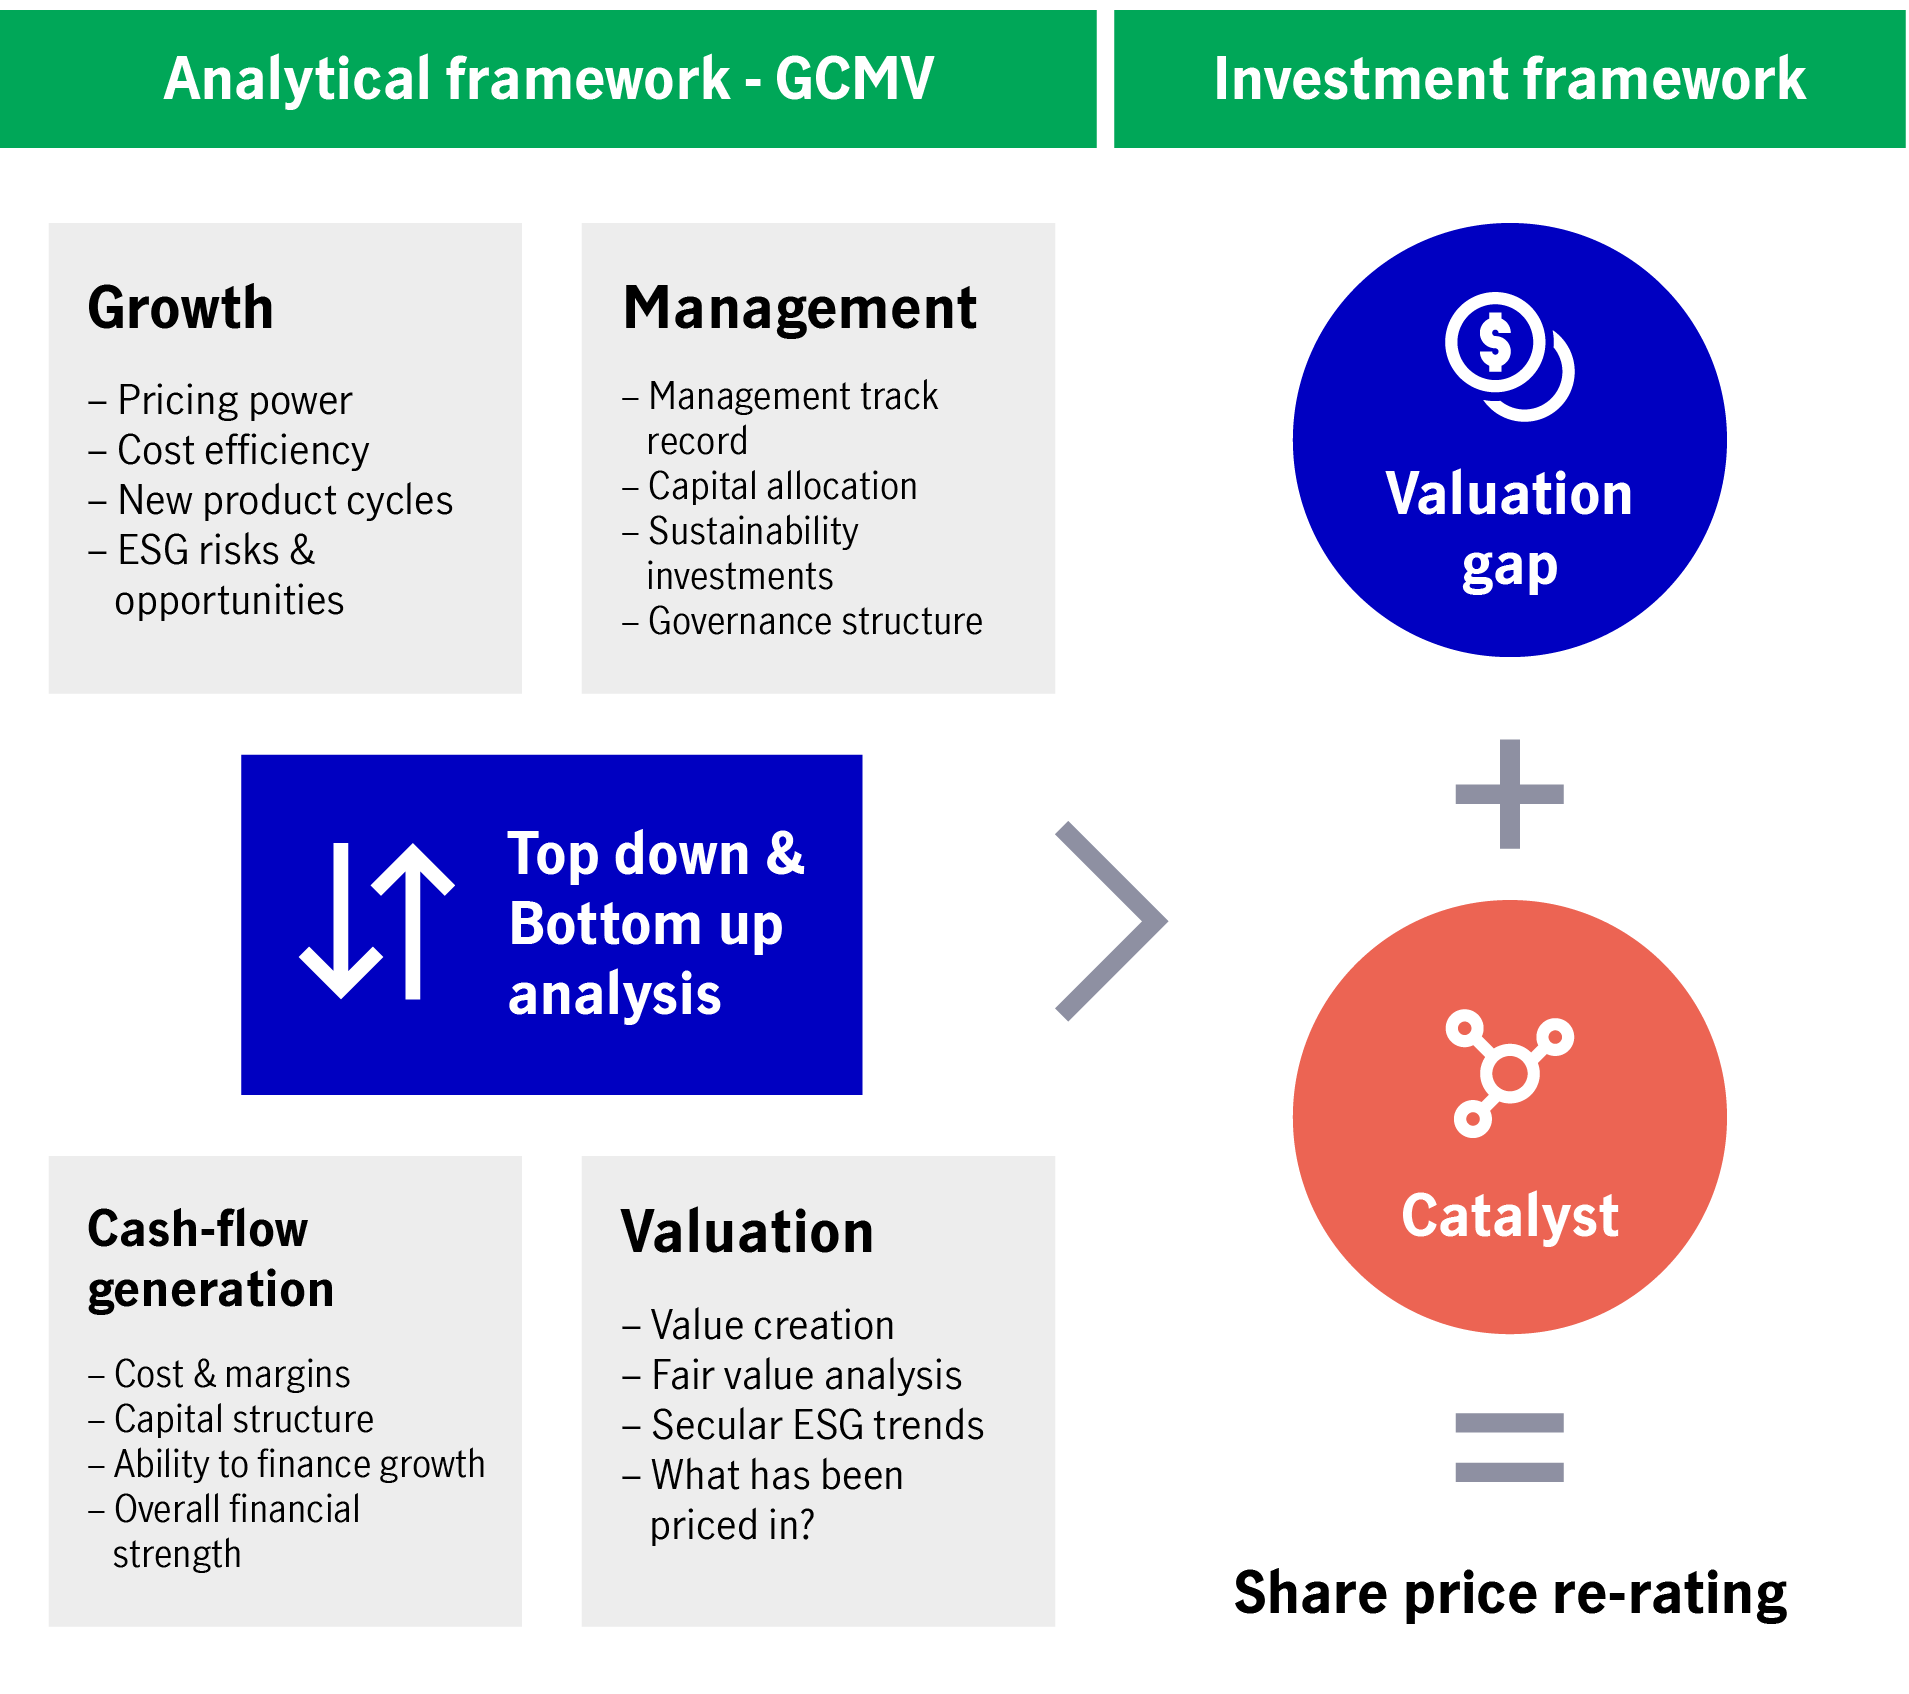
Our investment team uses the GCMV (growth, cash generation, management, valuation) + catalyst framework to conduct investment research.
This framework is applied for all company analysis and helps to identify companies with competitive advantages, strong financial profiles, earnings catalysts, and management teams that have created value for shareholders. Despite this focus, the investment team believes earnings alone are not sufficient to build conviction on a stock.
When we assess the growth potential (the “G”) of a company, we first identify the key drivers of growth and determine the sustainability of growth. This growth should be supported by the company’s ability to generate healthy cash flow (the “C”), which the management can use to reinvest on expansion and sustaining growth. We also assess the quality of management (the “M”). We believe good managers will be able to allocate capital efficiently, drive the business forward and capture good growth opportunities. Once we have identified companies that have satisfied these criteria, we determine the valuation of equities (the “V”). We will also identify the catalyst(s) that will close the valuation gap between the price and intrinsic value of the stock.
Investment process and framework: GCMV + Catalyst
4As positioning
For Greater China’s 4As positioning, we believe that there are four megatrends (i.e. the 4As) that present growth opportunities, which the team invests in via the GCMV lens.
Greater China’s 4As positioning remains intact in 2025
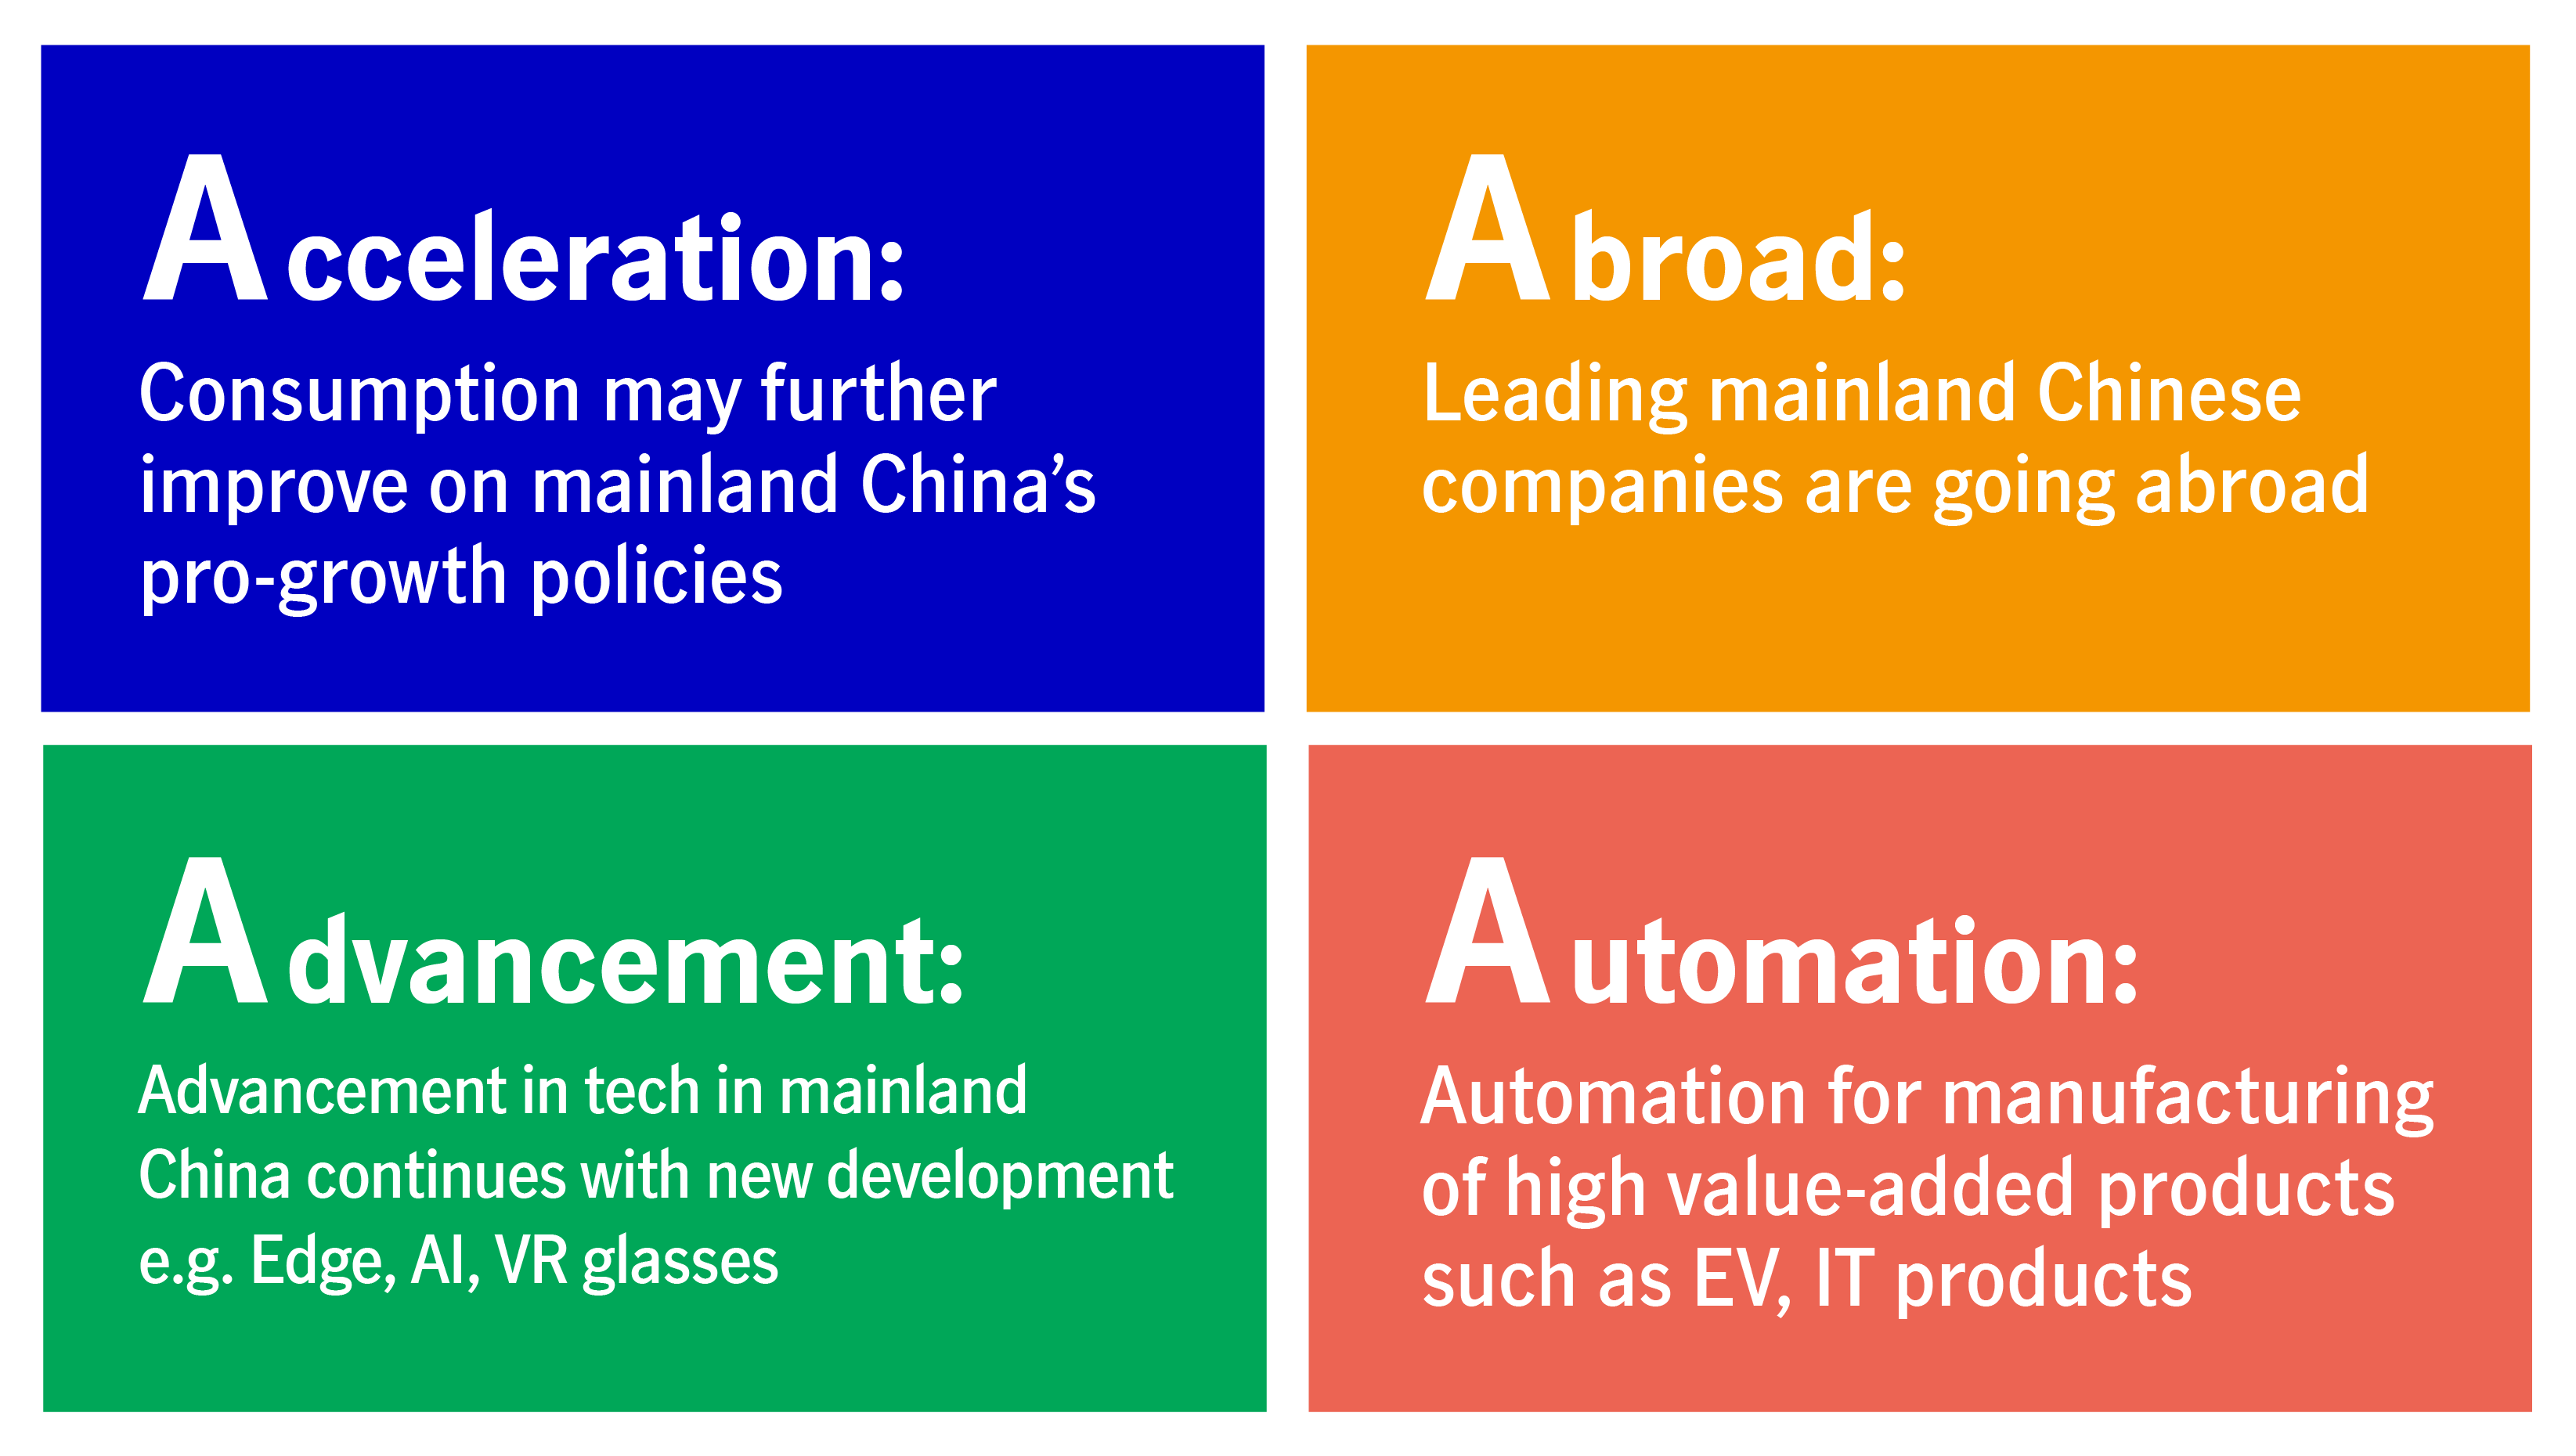
- 1st A – Acceleration
- 2nd A – Aboard
- 3rd A – Advancement
- 4th A – Automation
1st A – Acceleration
Mainland China’s recently announced monetary and fiscal policies are powerful which may help accelerate domestic consumption demand.
First and foremost, mainland China’s excess savings are holding up well in 2024. If policy execution in 2025 remains intact, corporate earnings may further improve, boosting consumer confidence and a willingness to spend. We favour service-oriented and niche consumption sectors, including:
- Technology, media and telecommunications (TMT) and platform companies (e.g food delivery, online music)
- Education
- Tourism
- Home appliance (e.g. smart appliance)
Mainland China online music
Mainland China has a significant total addressable market (TAM) upside in music sales as its online music industry remains under-monetised and underpenetrated.
Music is the third most popular interest for the mainland Chinese youth user group, according to Quest mobile. Therefore, we see large growth potential in terms of mainland China’s music revenue scale as of nominal GDP proven (see Chart 7).
Chart 7: Top interests by share of active youth users (February 2024)
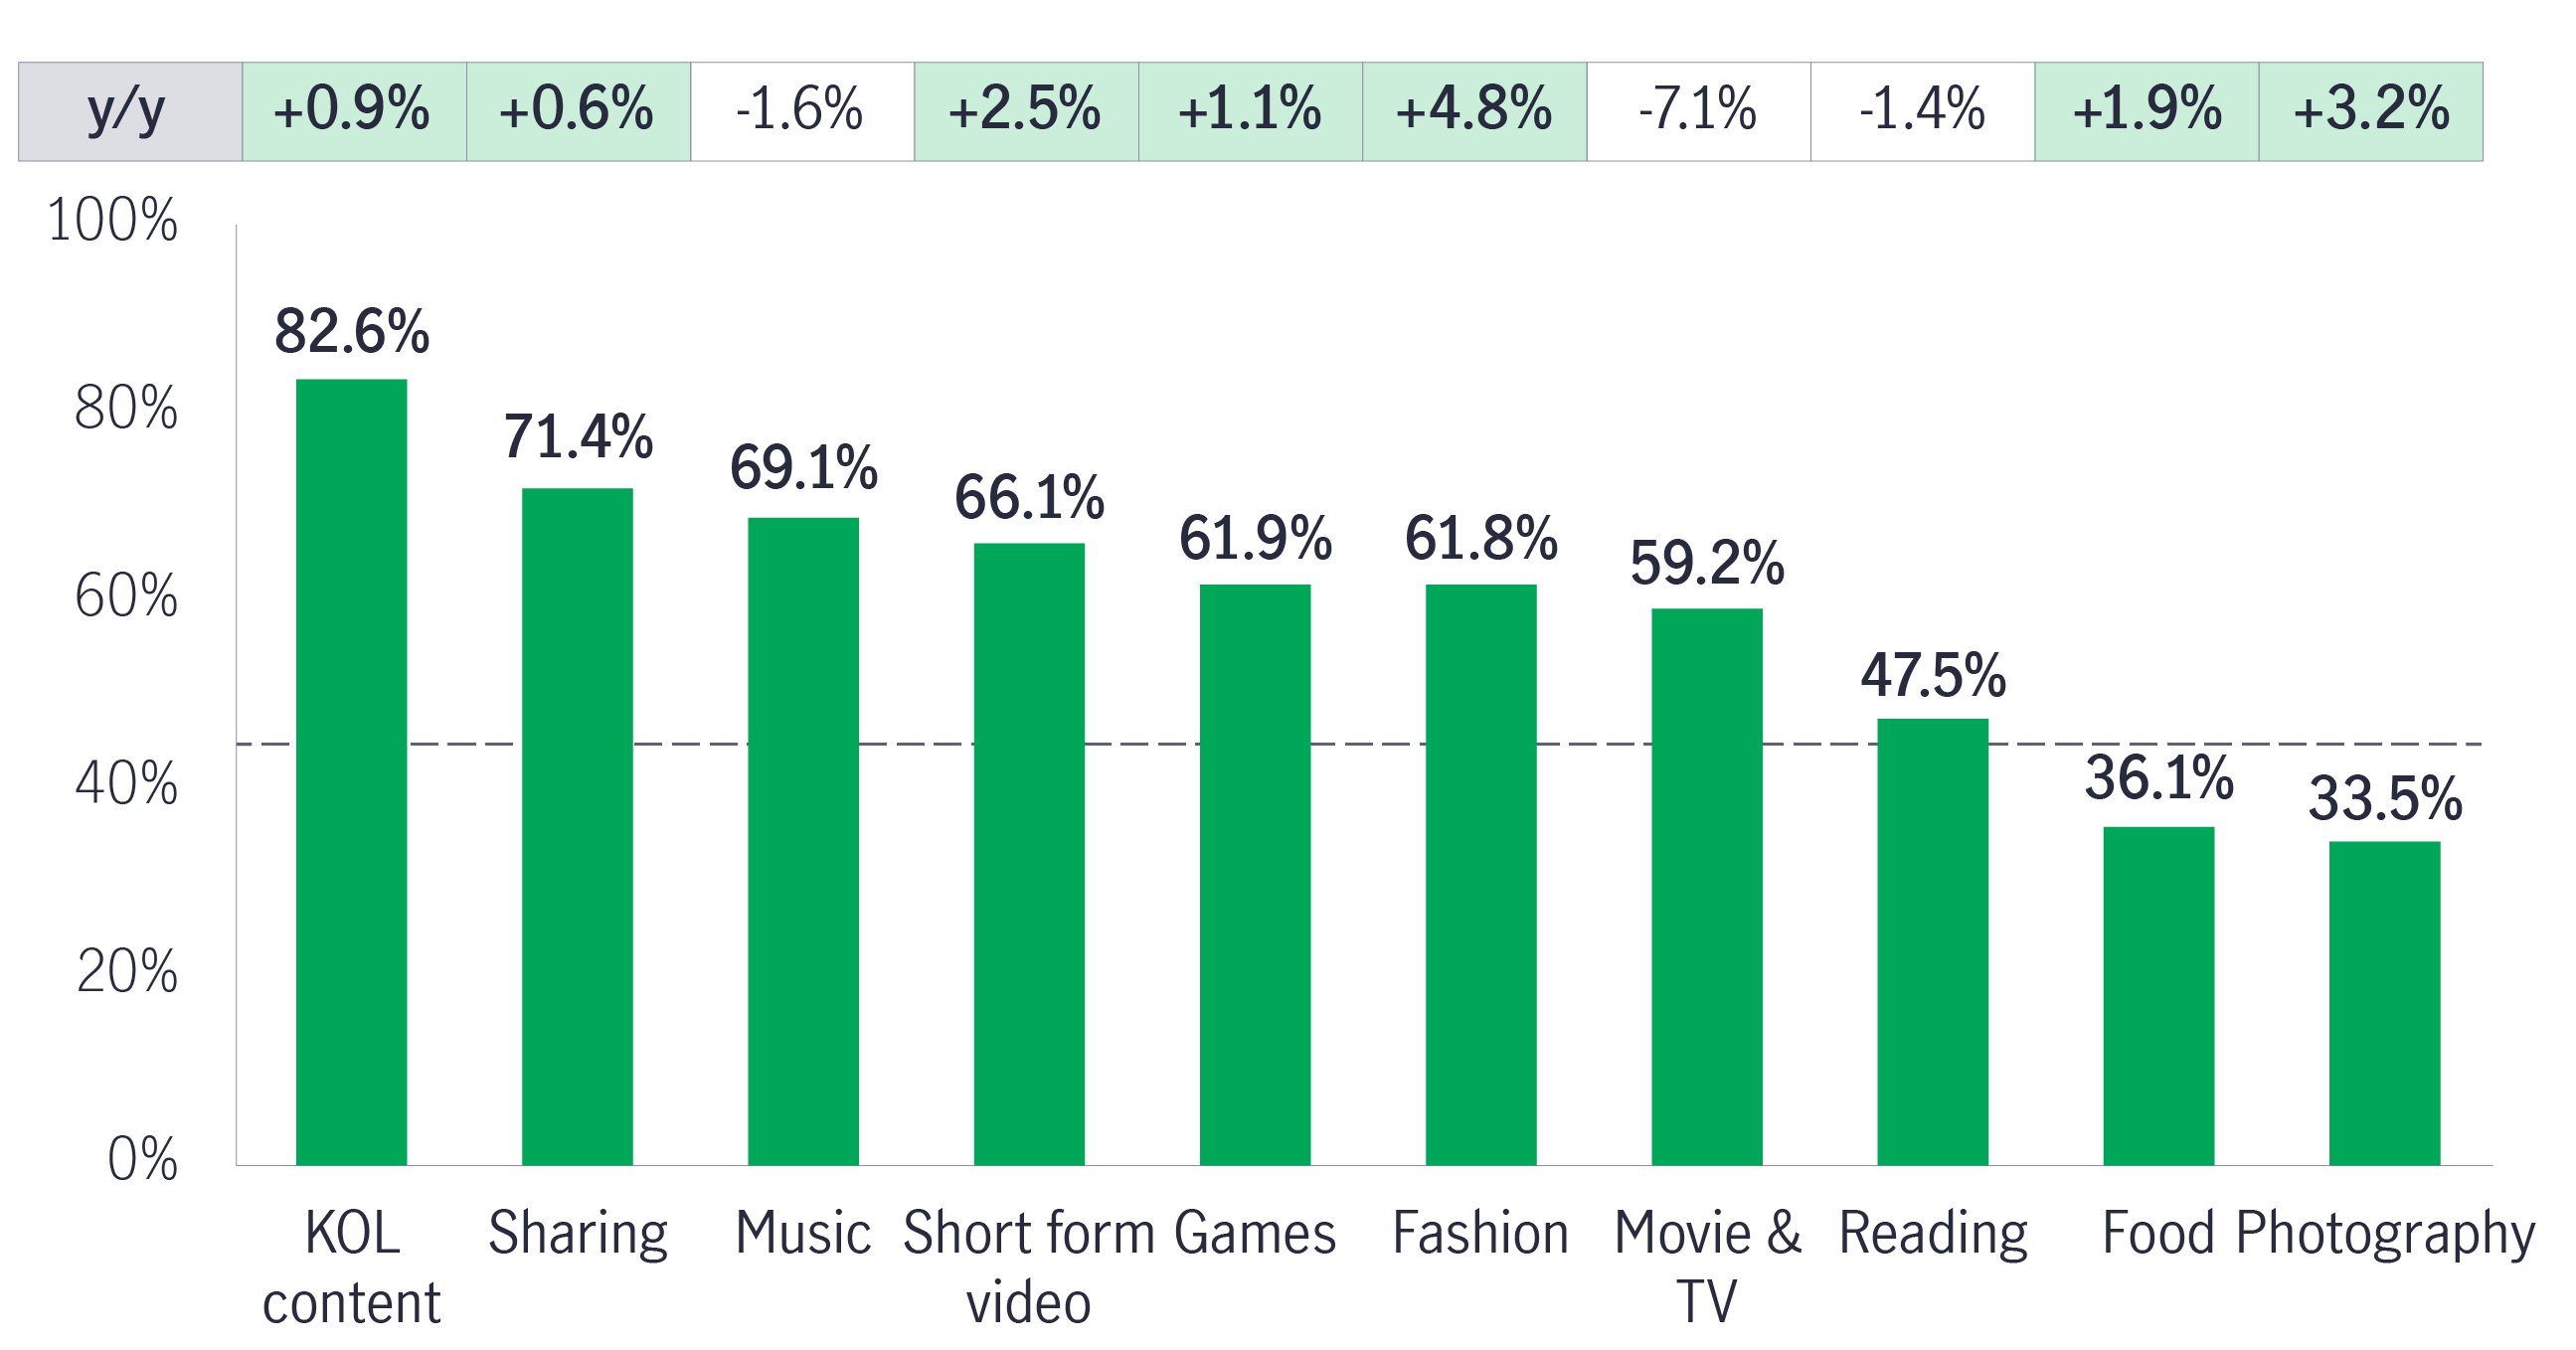
Chart 8: Music revenue scale as of nominal GDP
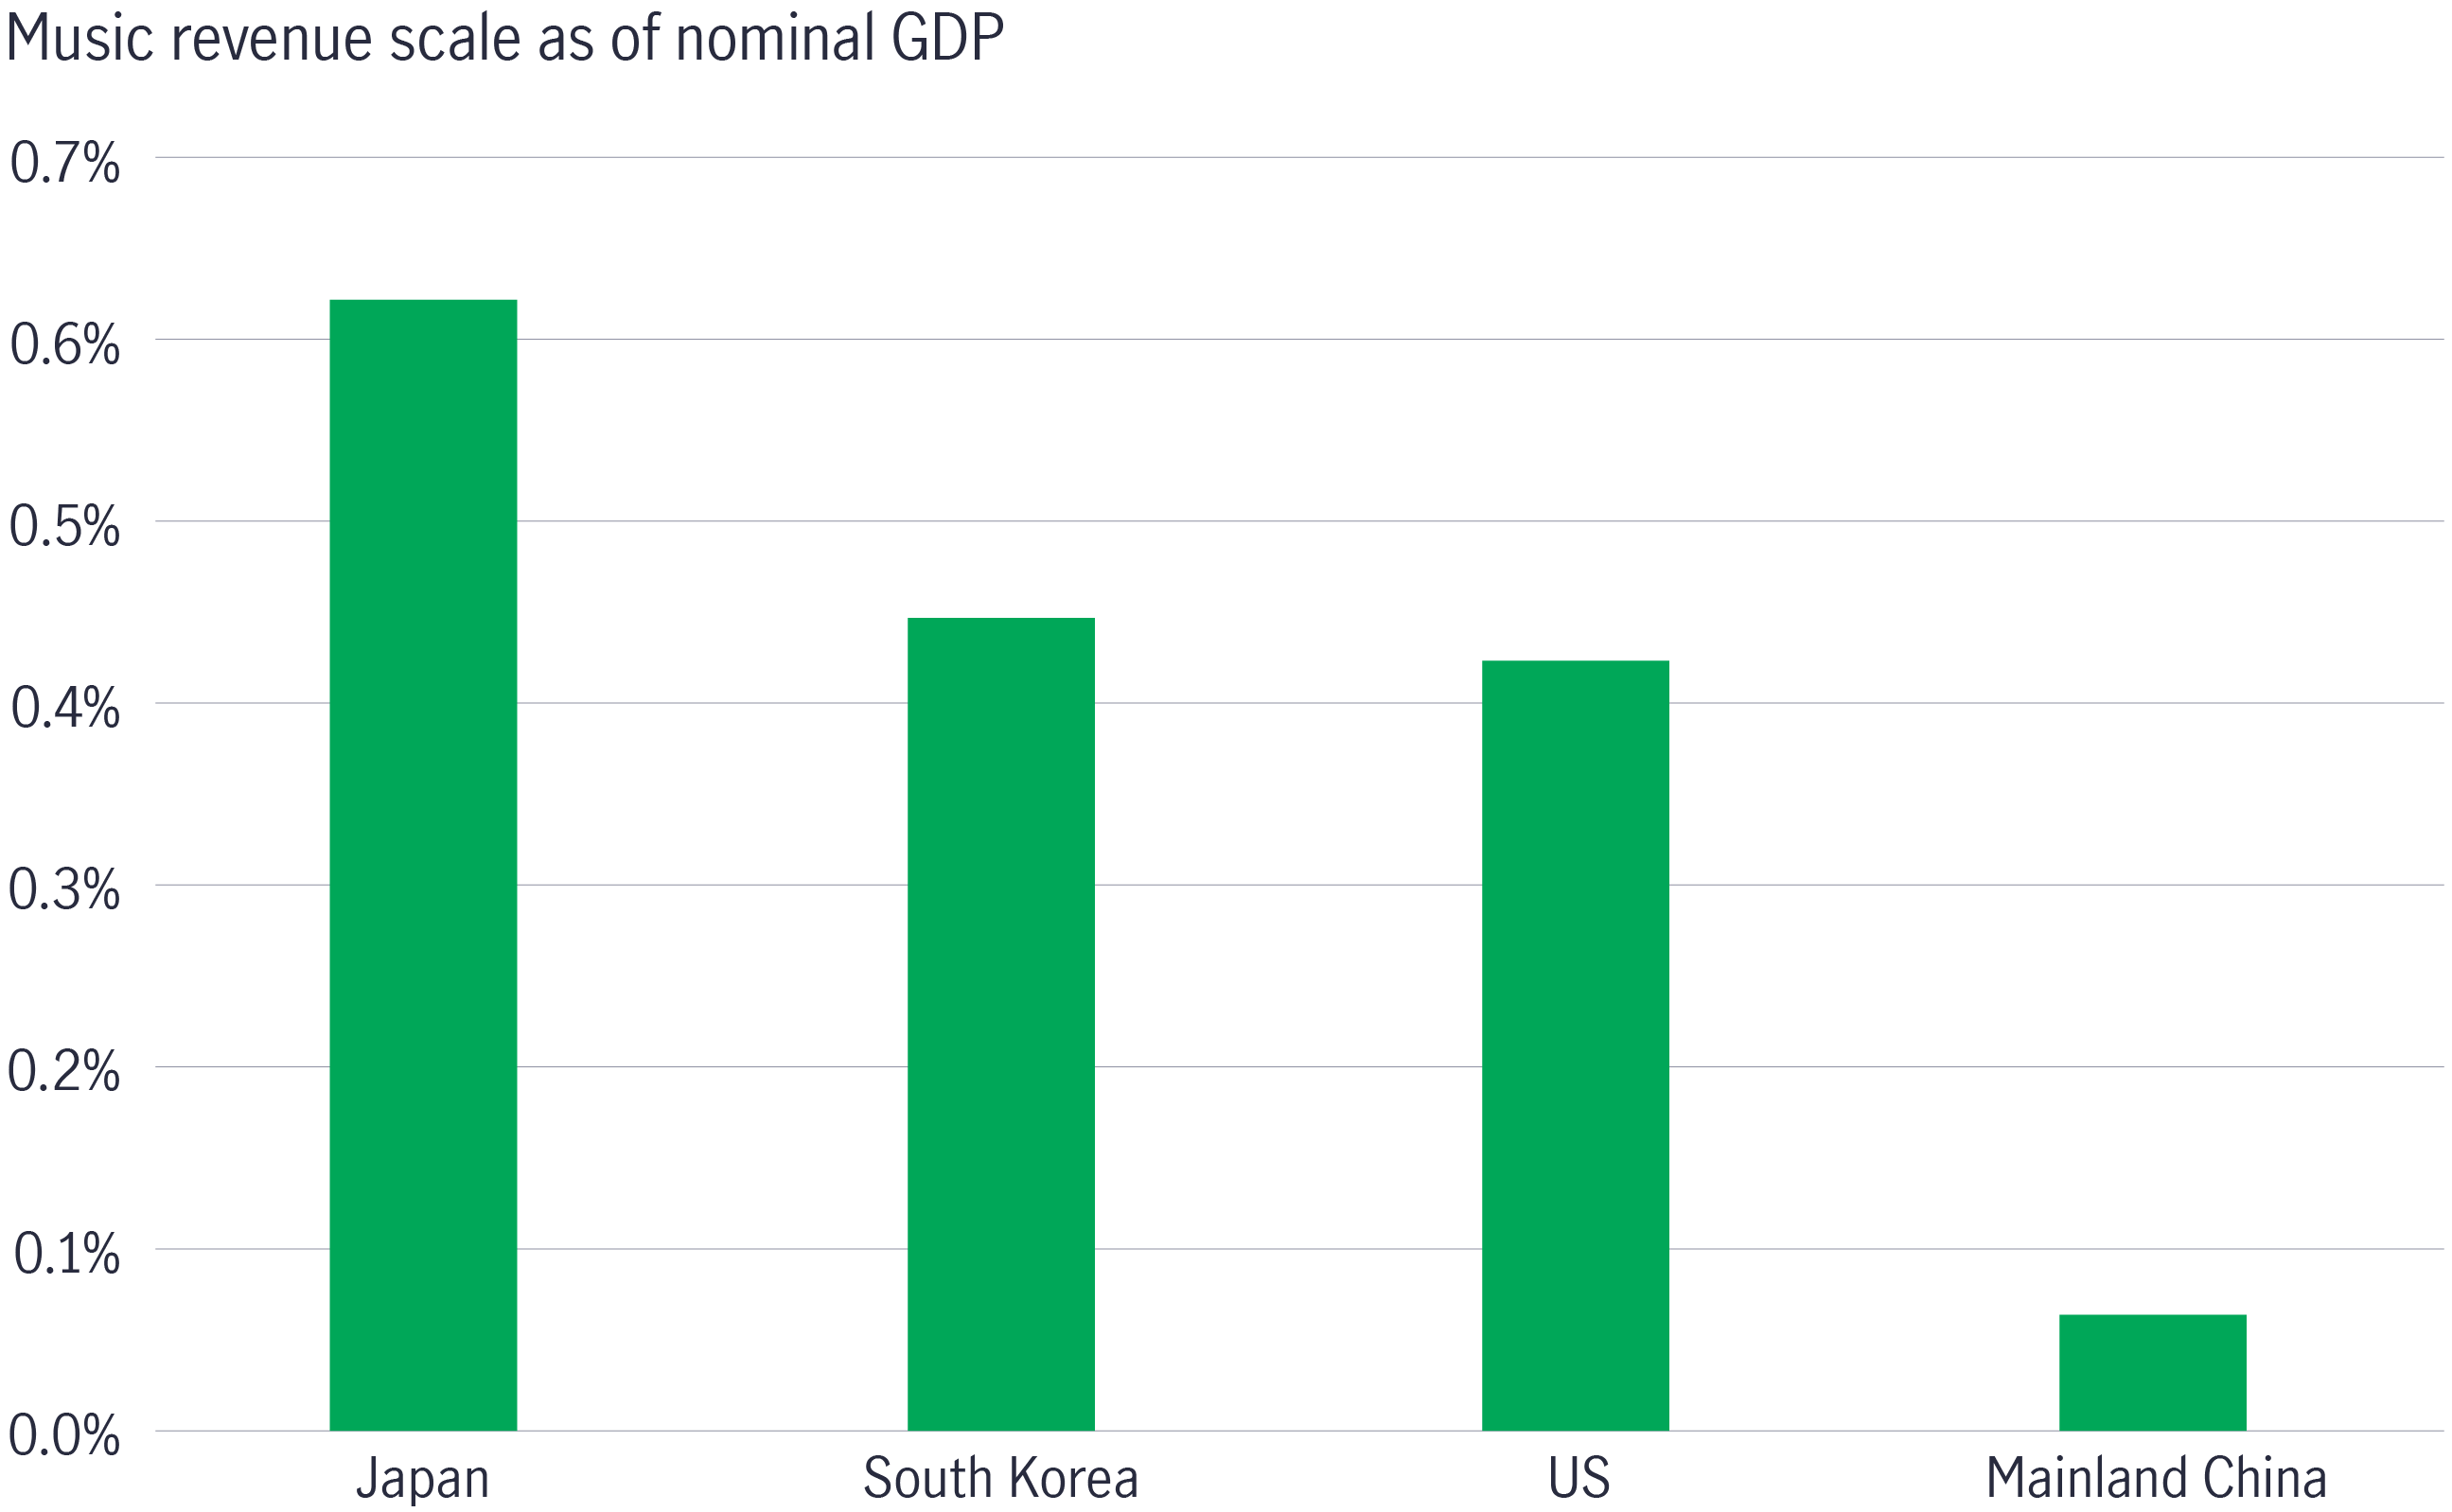
Mainland China's music subscriber level is now at 130-140 million, just about half the total number of video subscribers (250-300 million).
We favour players who can achieve margin expansion by leveraging music content cost and increasing self-produced content with stable operating capital expenditure. Key catalysts include the average revenue per paying user (ARPPU) cycle, broader content and greater monetisation.
Below is an investment case for an online music player via the GCMV plus catalyst lens:
Investment case: A mainland Chinese online music platform company
Growth (G) |
|
| Cash Flow (C) |
|
Management (M) |
|
| Valuation (V) |
|
| Catalyst (Catalyst) |
|
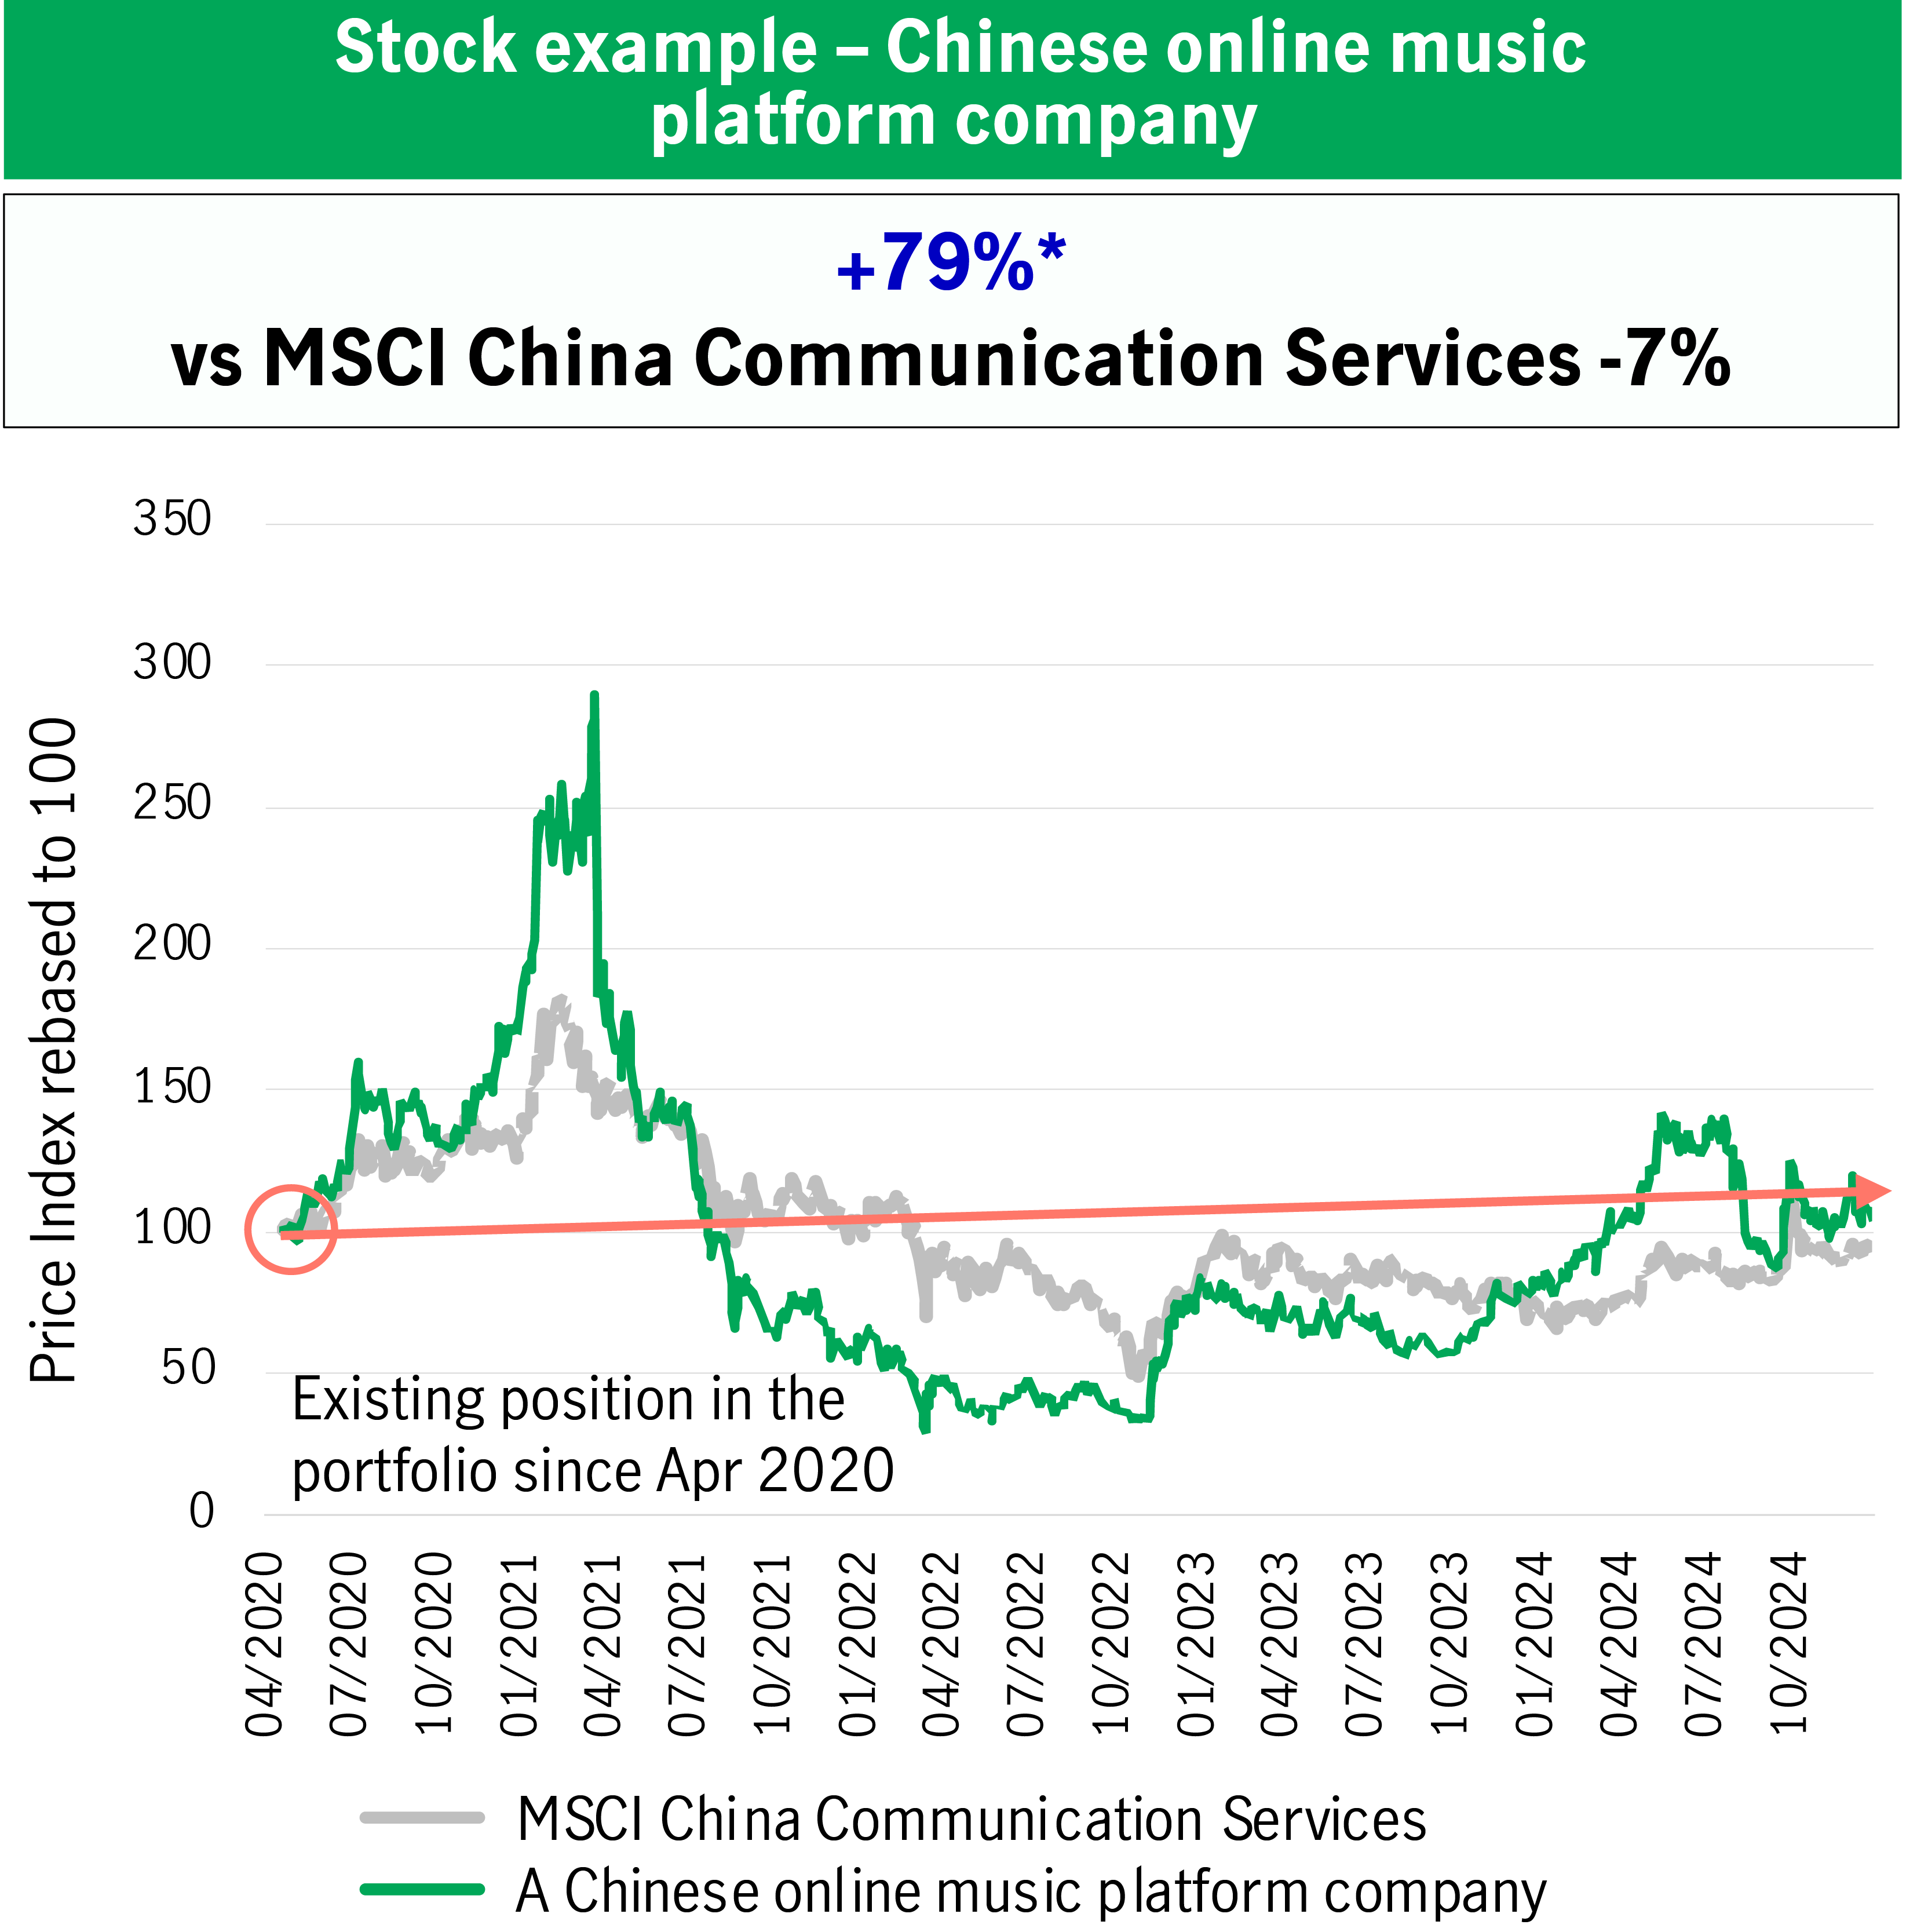
Chart 9: A mainland Chinese online music platform company outperformed
Mainland China education
We believe the mainland China education sector's demand for non-academic services remains strong, independent of macro trends. Following the industry consolidation that has taken place since 2021 (‘double reduction’), the overall competitive landscape has become more favourable.
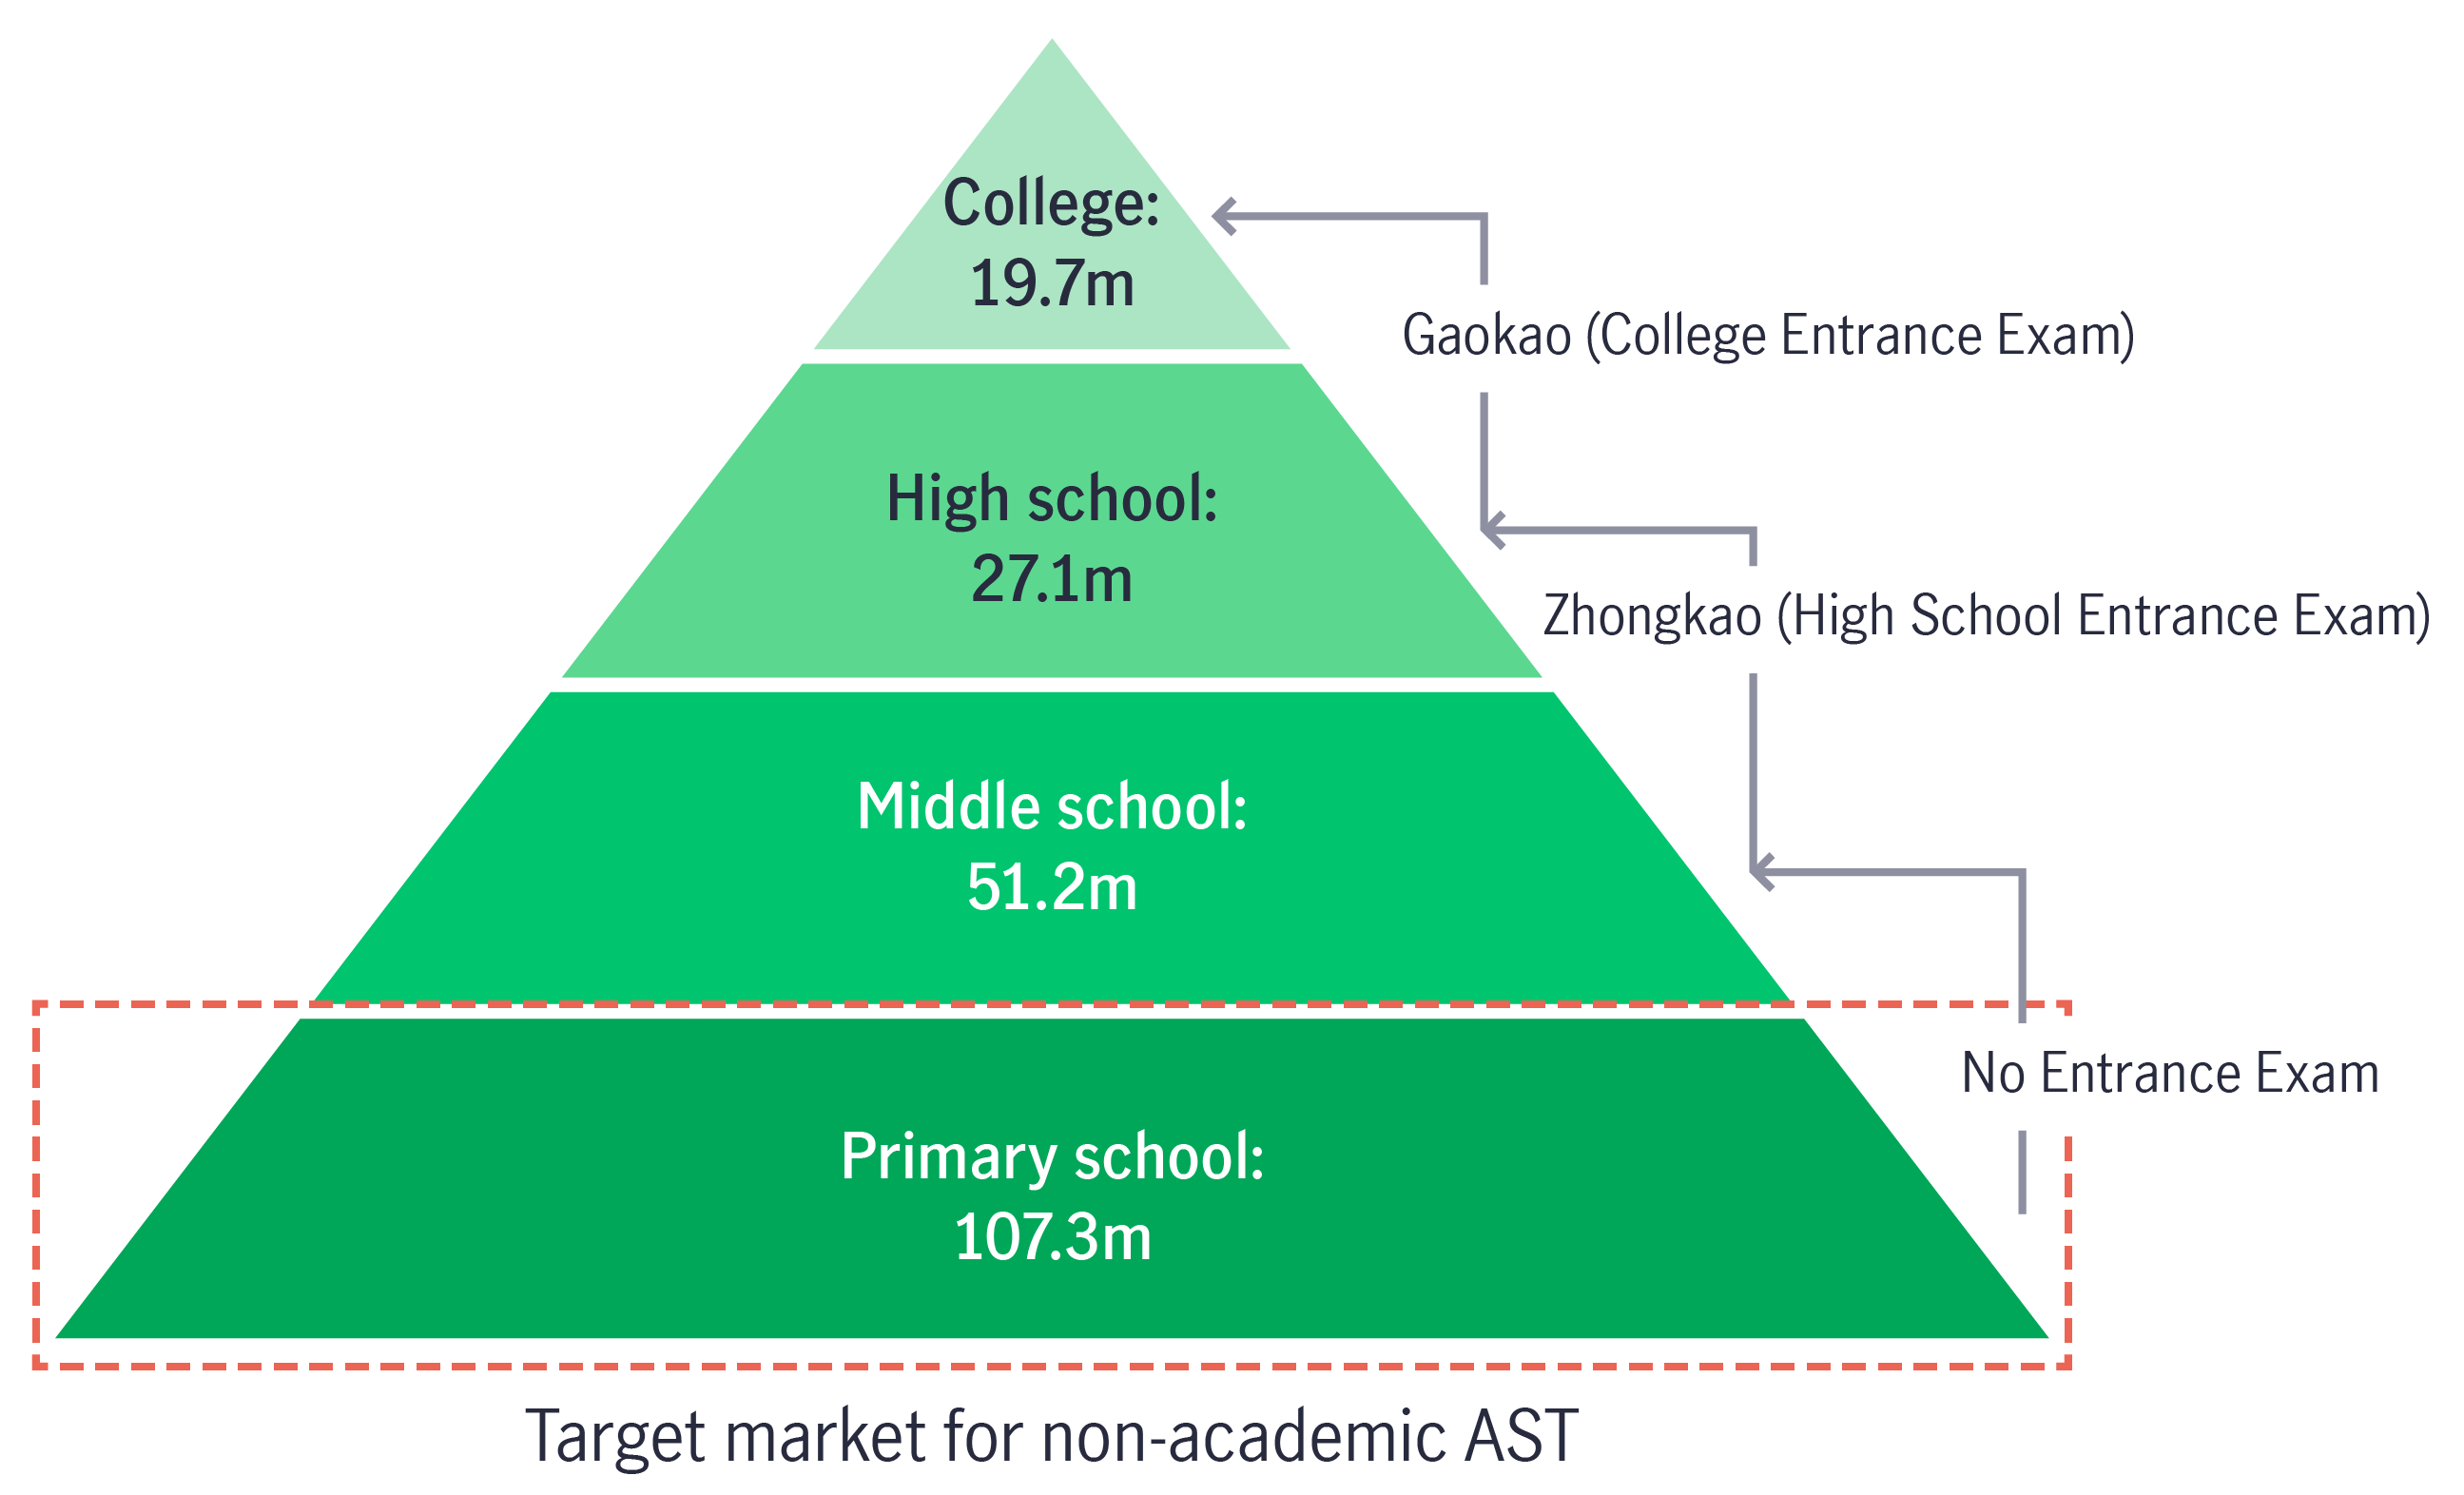
The total addressable population is now more targeted towards elementary school students in tier 1-2 cities (26.1 million) instead of the total after-school (K12) population of 184.2 million. The ‘survivors’ in the industry benefit from a higher average selling price (ASP) per class and better margins from new business model innovation (aside from ‘traditional classes’).
We favour leading players with brand reputations and rich experience with tutoring while leveraging their strong research and development and teaching systems (e.g. smart tablets) to gain market share.
Chart 10: Mainland Chinese student population
We also see education and online music/gaming as relatively safe havens from a bottom-up perspective.
2nd A – Abroad
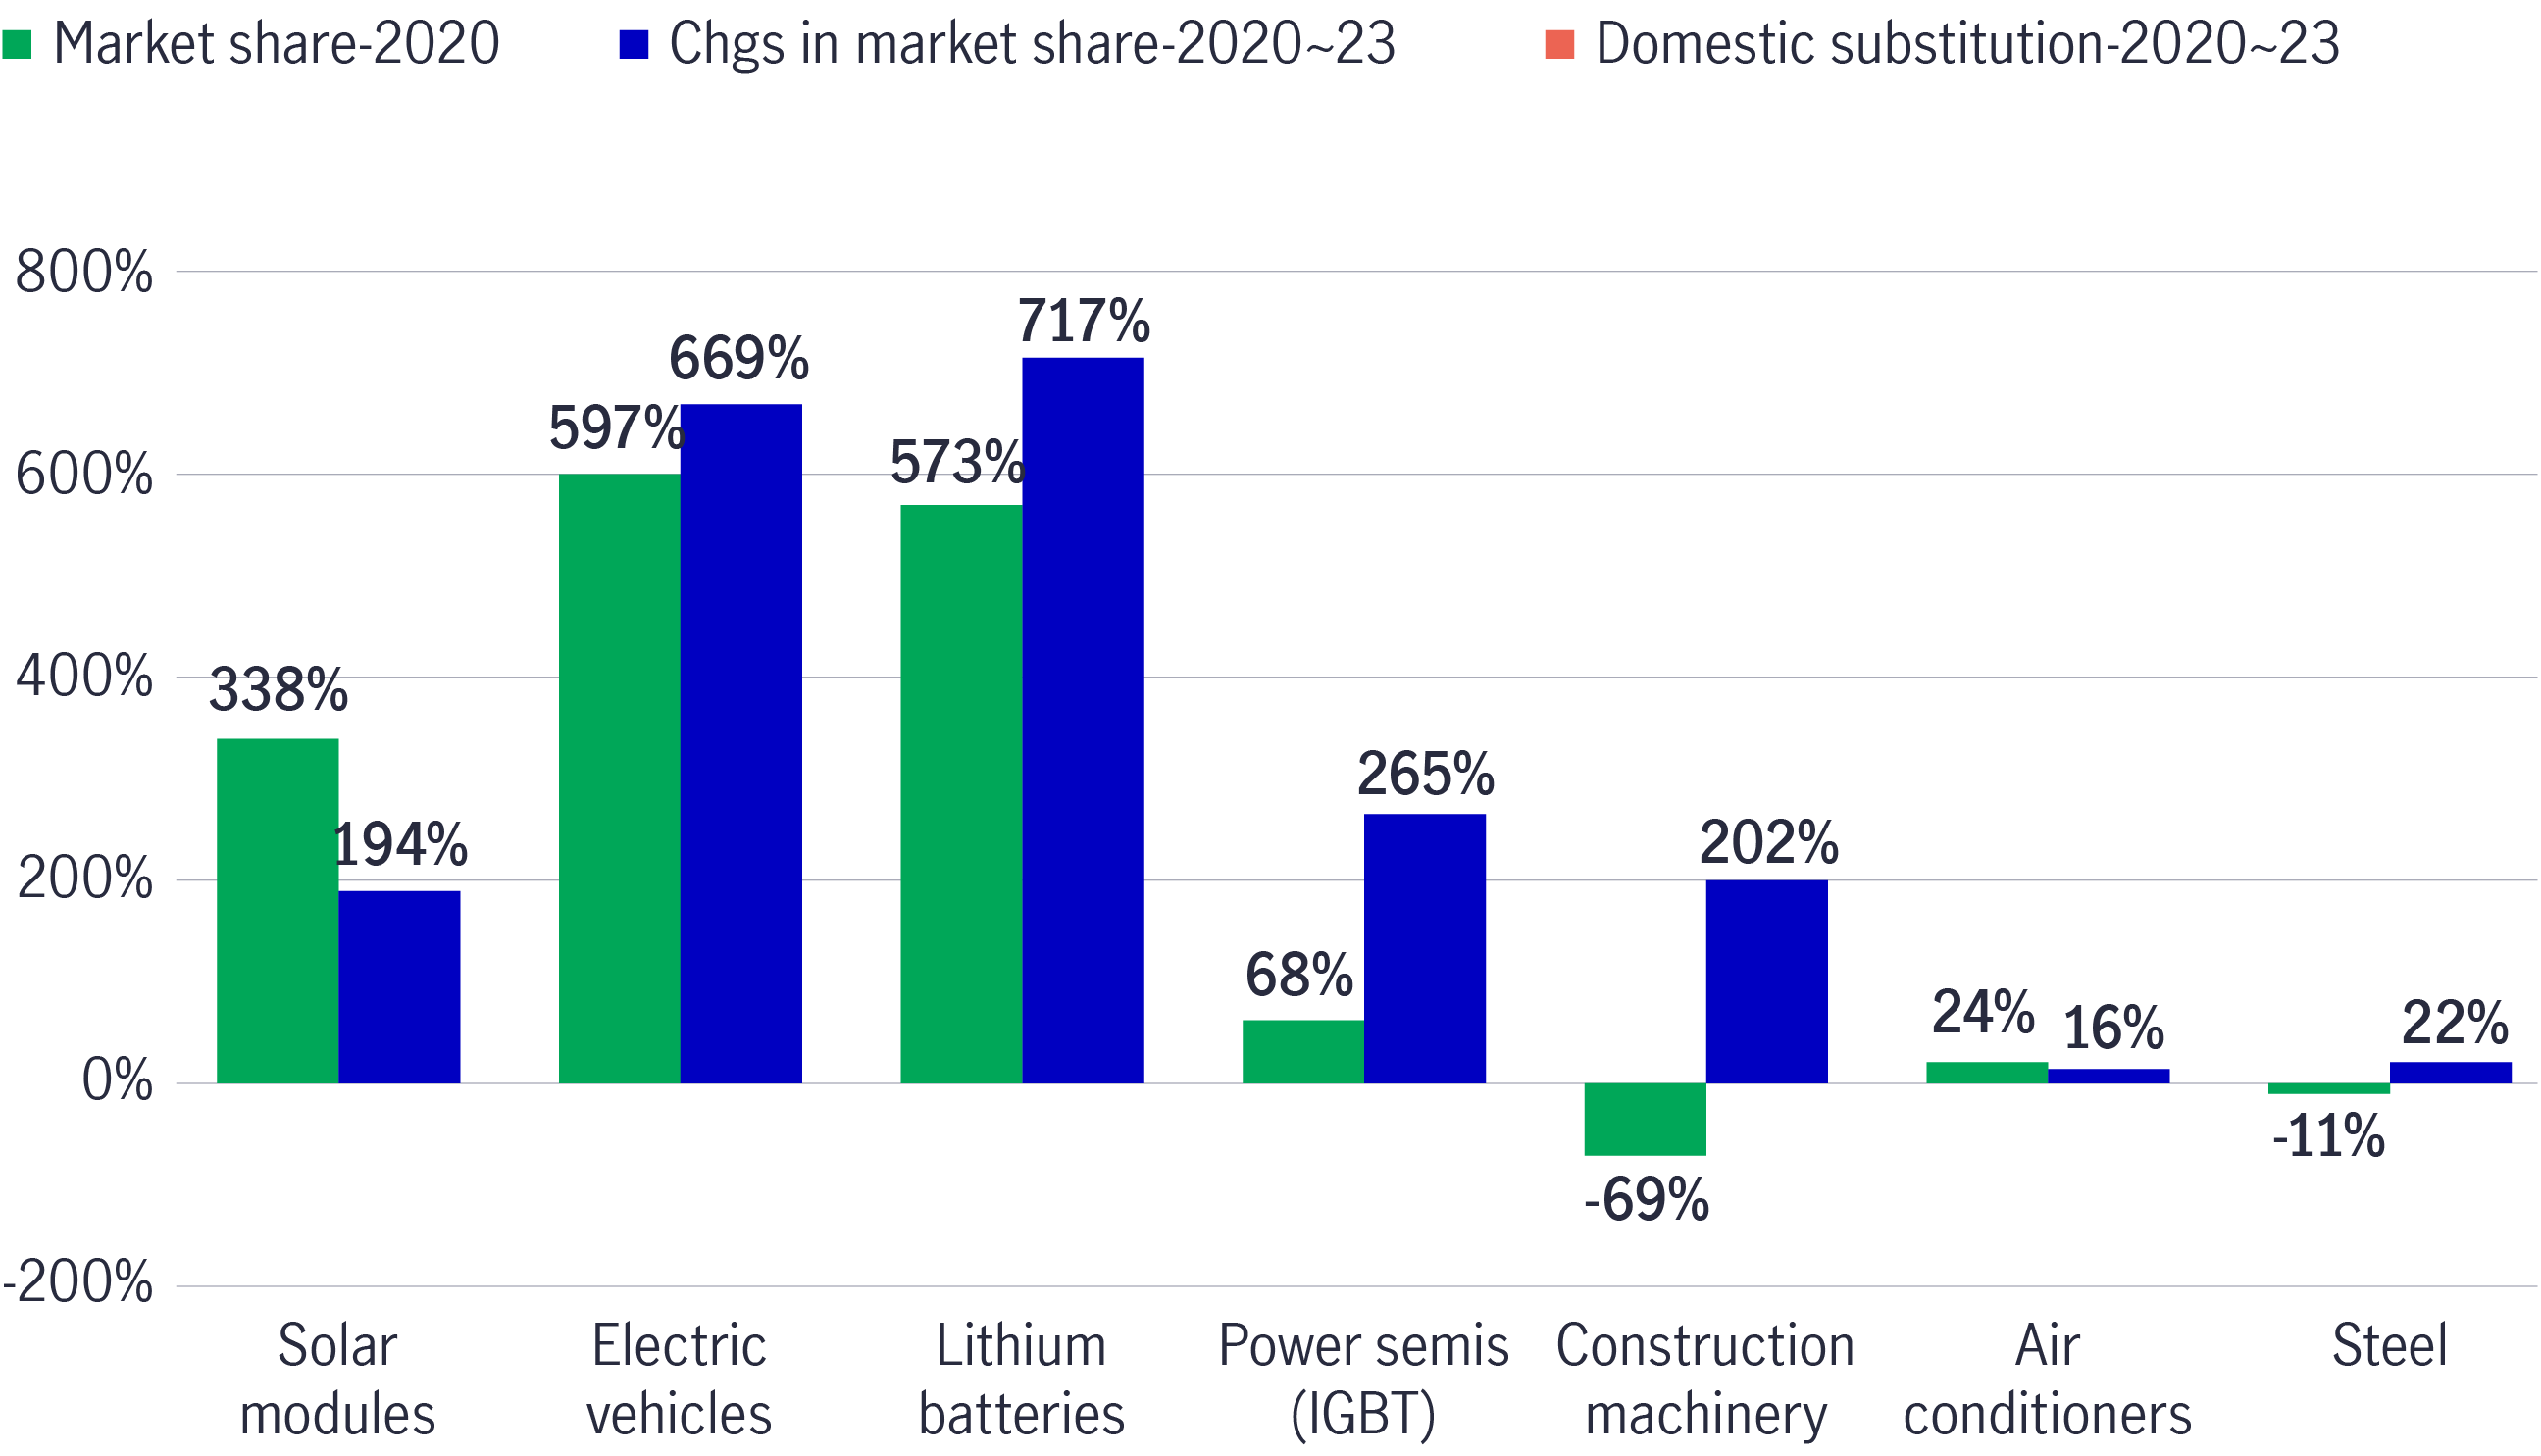
Mainland China remains a leader in the global supply chain, commanding dominant market positions in major product categories. For example, the country is a leading supplier of air conditioners (75% of global supply), solar modules (86% of global supply), lithium batteries (81%), electric vehicles (66%), power semiconductors (insulated-gate bipolar transistors) (29%) (see Chart 11).
Chart 11: Mainland China remains a leader in global supply chain

Over the last few years, most of the aforementioned categories have achieved more significant market share and growth than three years ago (see Chart 12&13). Therefore, mainland China is progressing well on many fronts with localisation and overseas markets.
We prefer leading companies with strong innovative capabilities and global footprints in the healthcare, industrial, electric vehicle and consumption sectors. Some early movers have established research and development centres and production plants overseas and localised their operations to mitigate tariff headwinds. For healthcare, we favour biopharmaceutical companies with strong pipelines and out-licensing opportunities with global foreign players. We also prefer mainland China’s leading medical device players with an extensive global footprint that are innovative leaders in the manufacturing of advanced medical equipment.
Chart 12: Market share of mainland Chinese exports in ex-mainland China (%)
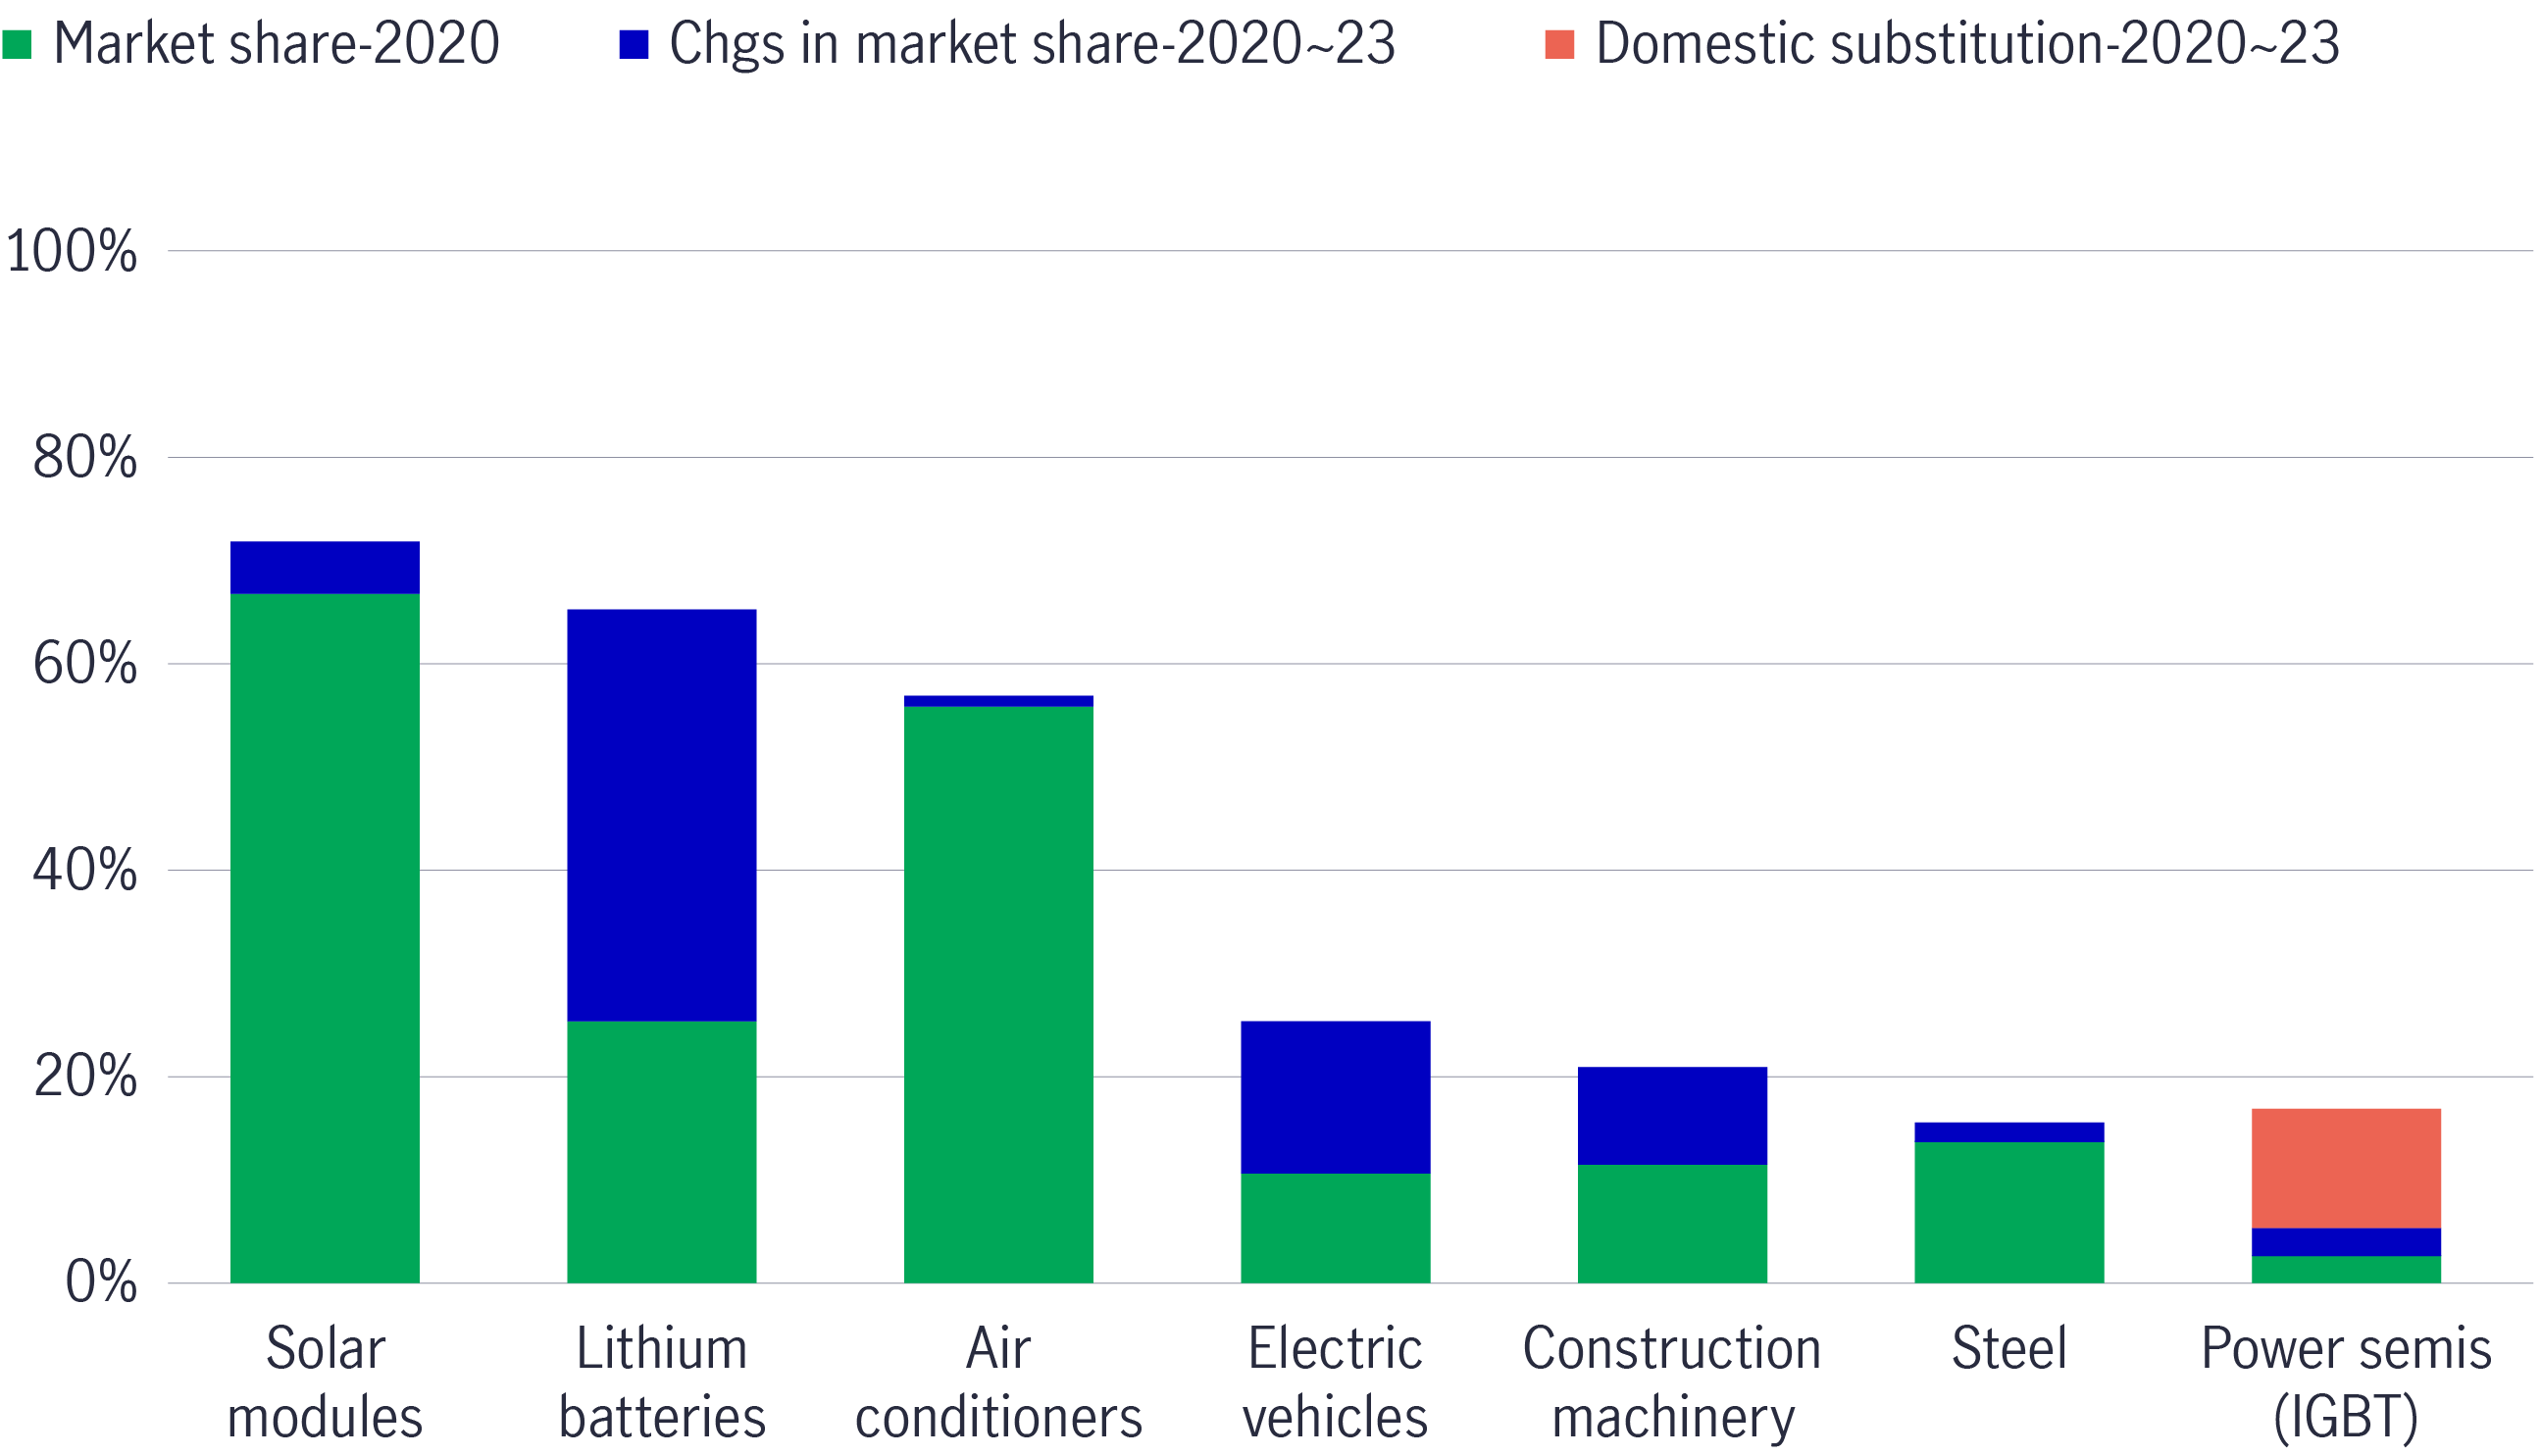
Chart 13: Market share changes in mainland China’s domestic demand and exports 2020-23 (%)
3rd A – Advancement
We believe in the advancement of technology innovation. Going into 2025, we see more AI adoption, with a proliferation of AI devices, such as AI personal computers (PCs), AI smartphones, AI smart glasses, etc.
What is Edge AI? Who are the key beneficiaries?
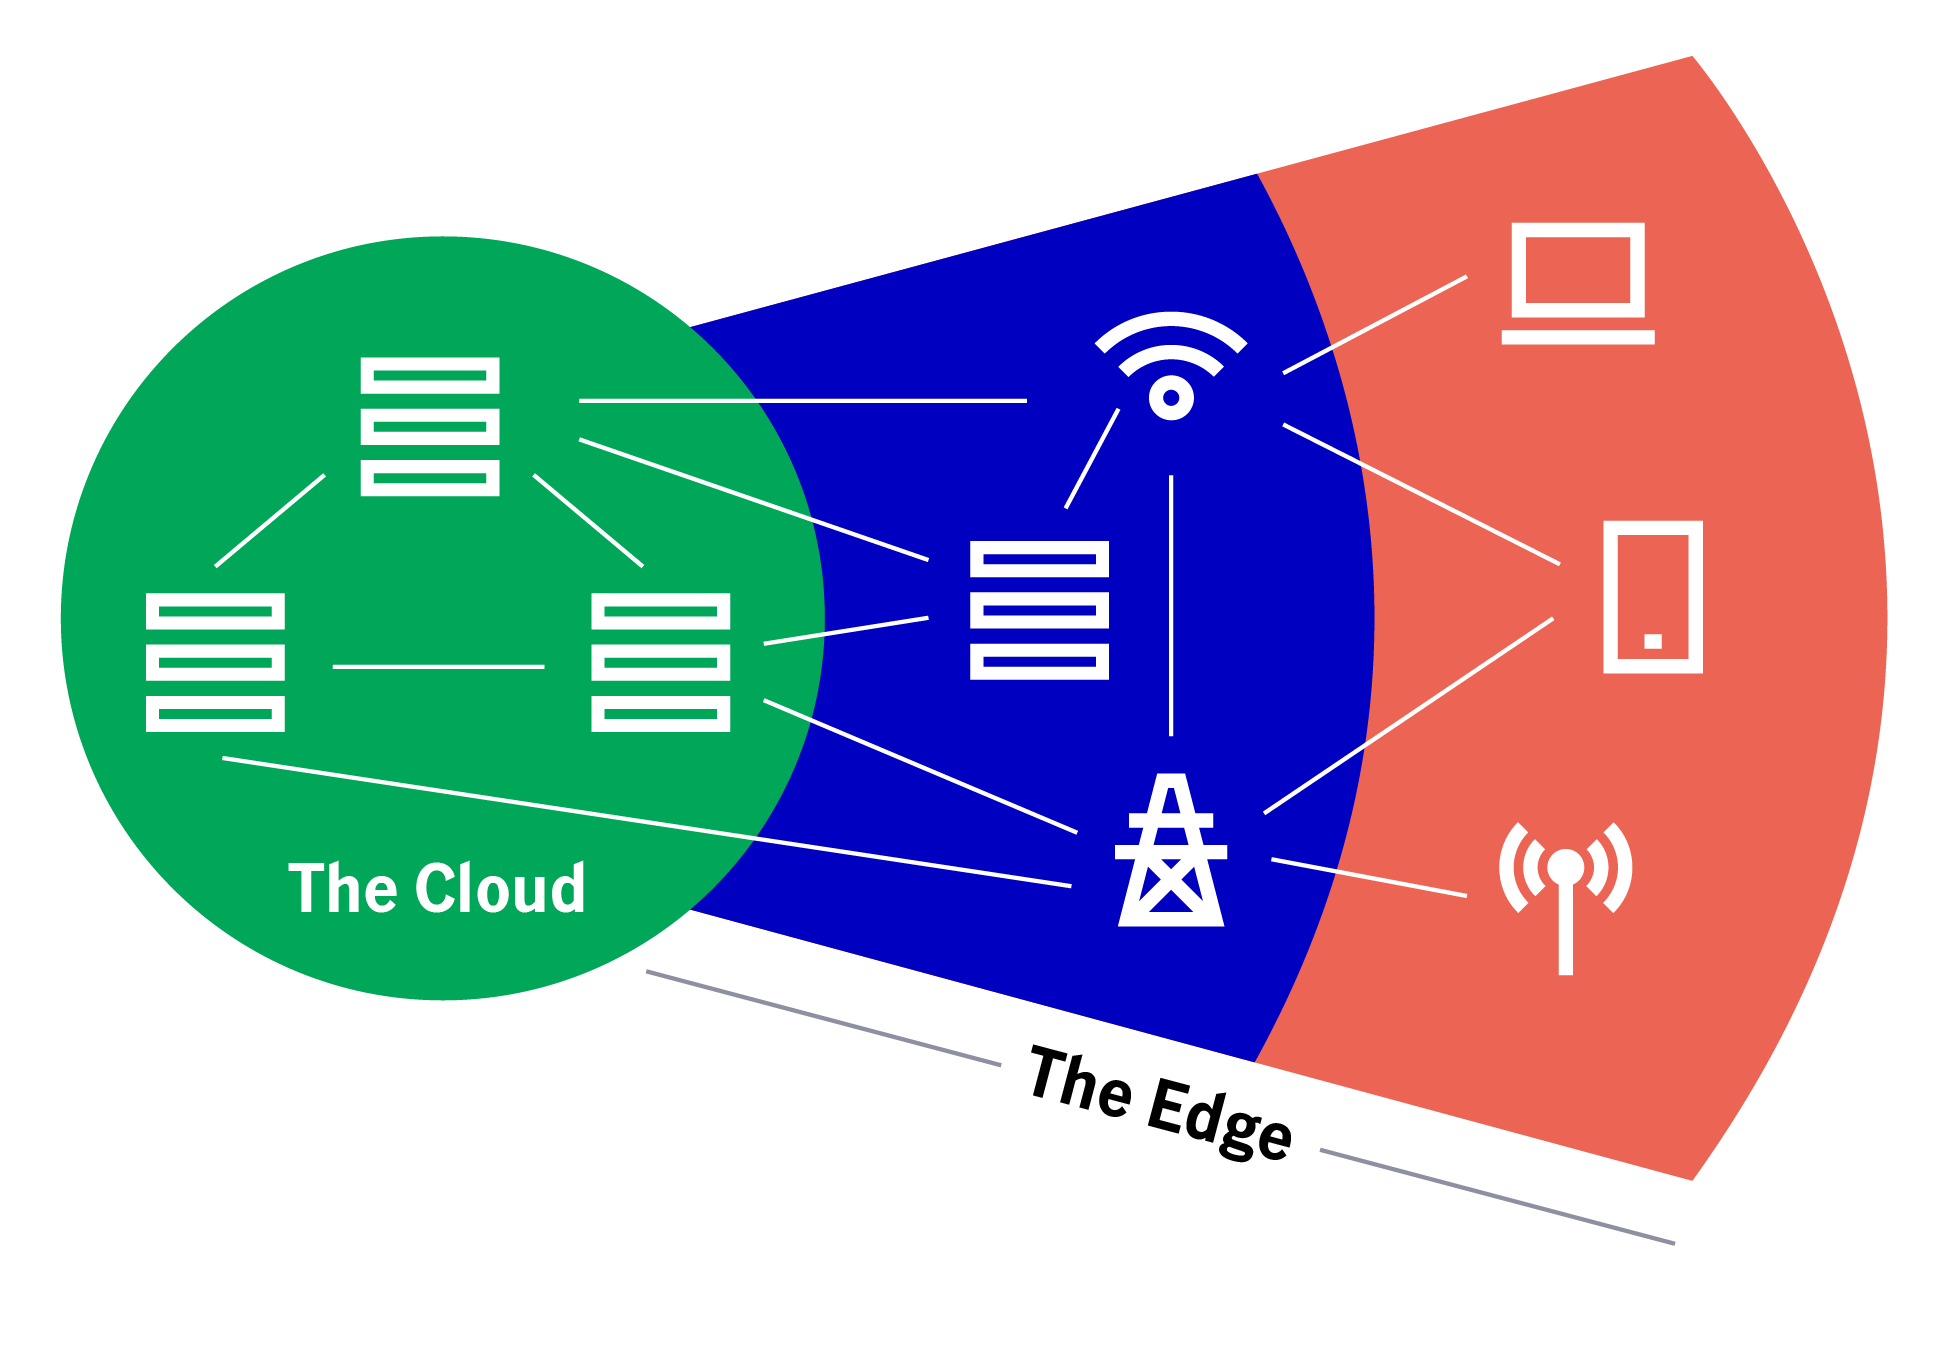
Edge refers to computation at the ‘edge’ of a network, such as running AI algorithms locally on hardware devices rather than from the cloud via centralised data centres (see Chart 14). In other words, it is closer to the point at which the data is generated, which saves costs, reduces latency (“delay”), rationalises bandwidth, enhances privacy, and allows for real-time processing at the point where the data is collected.
Chart 14: Edge AI: Ecosystem Diagram
Edge AI is not new (see Chart 15). ‘The Edge’ has historically been loosely interchangeable with the ‘Internet of Things’ (IoT) or ‘Industrial IoT’, which has been through its own hype cycles over time. The investment case for Edge AI brings opportunities, including (1) battery and power consumption, (2) processing power and memory, (3) form factor and (4) applicable use cases.
Chart 15: Leading companies’ AI technologies

Solution providers (the ‘enablers’) of Edge AI (see Chart 16) will need to expand their battery capacity, reduce the power consumption of components, improve the processing power of devices, free up space for upgraded hardware and leverage developer kits to build killer apps for constrained devices.
Wider adoption of Edge AI benefits many areas, including (1) smartphones and autos, (2) PC and wearables/IoT, (3) augmented reality (AR) and virtual reality (VR) and drones, and (4) autos and wearables/IoT.
Chart 16: Enabler stocks for the Edge AI shift

In terms of investment opportunities, we favour the following areas:
- AI wearable devices
- AI smartphone supply chain
- Autonomous vehicles
AI wearable devices
AI smart glasses are emerging. According to Euromonitor and International Data Corporation (IDC), the total addressable market (in terms of volume) for eyewear and sunglasses reached around 14.5 billion units and 402 million units in 2023, versus total global smartphone shipments of around 1.2 billion units in 2023.
The inflection points are around the corner as the cost of AI devices /glasses becomes more affordable and closer to the prices of regular sunglasses (e.g. around USD300). AI smart glasses paired with microphones or cameras, chipset, voice recording, storage and WiFi can achieve some AI functionality.
We favour the AI smart glasses supply chain – e.g. optical module makers, AI glasses manufacturers, cameras, lenses., etc. New functions, such as object identification and voice recognition, are required. As such, supply-chain players (speakers, microphones, camera sensors and chipsets) drive opportunities for the component supply chain (see Chart 17).
Chart 17: Components of AI smart glasses

AI smartphone value chain
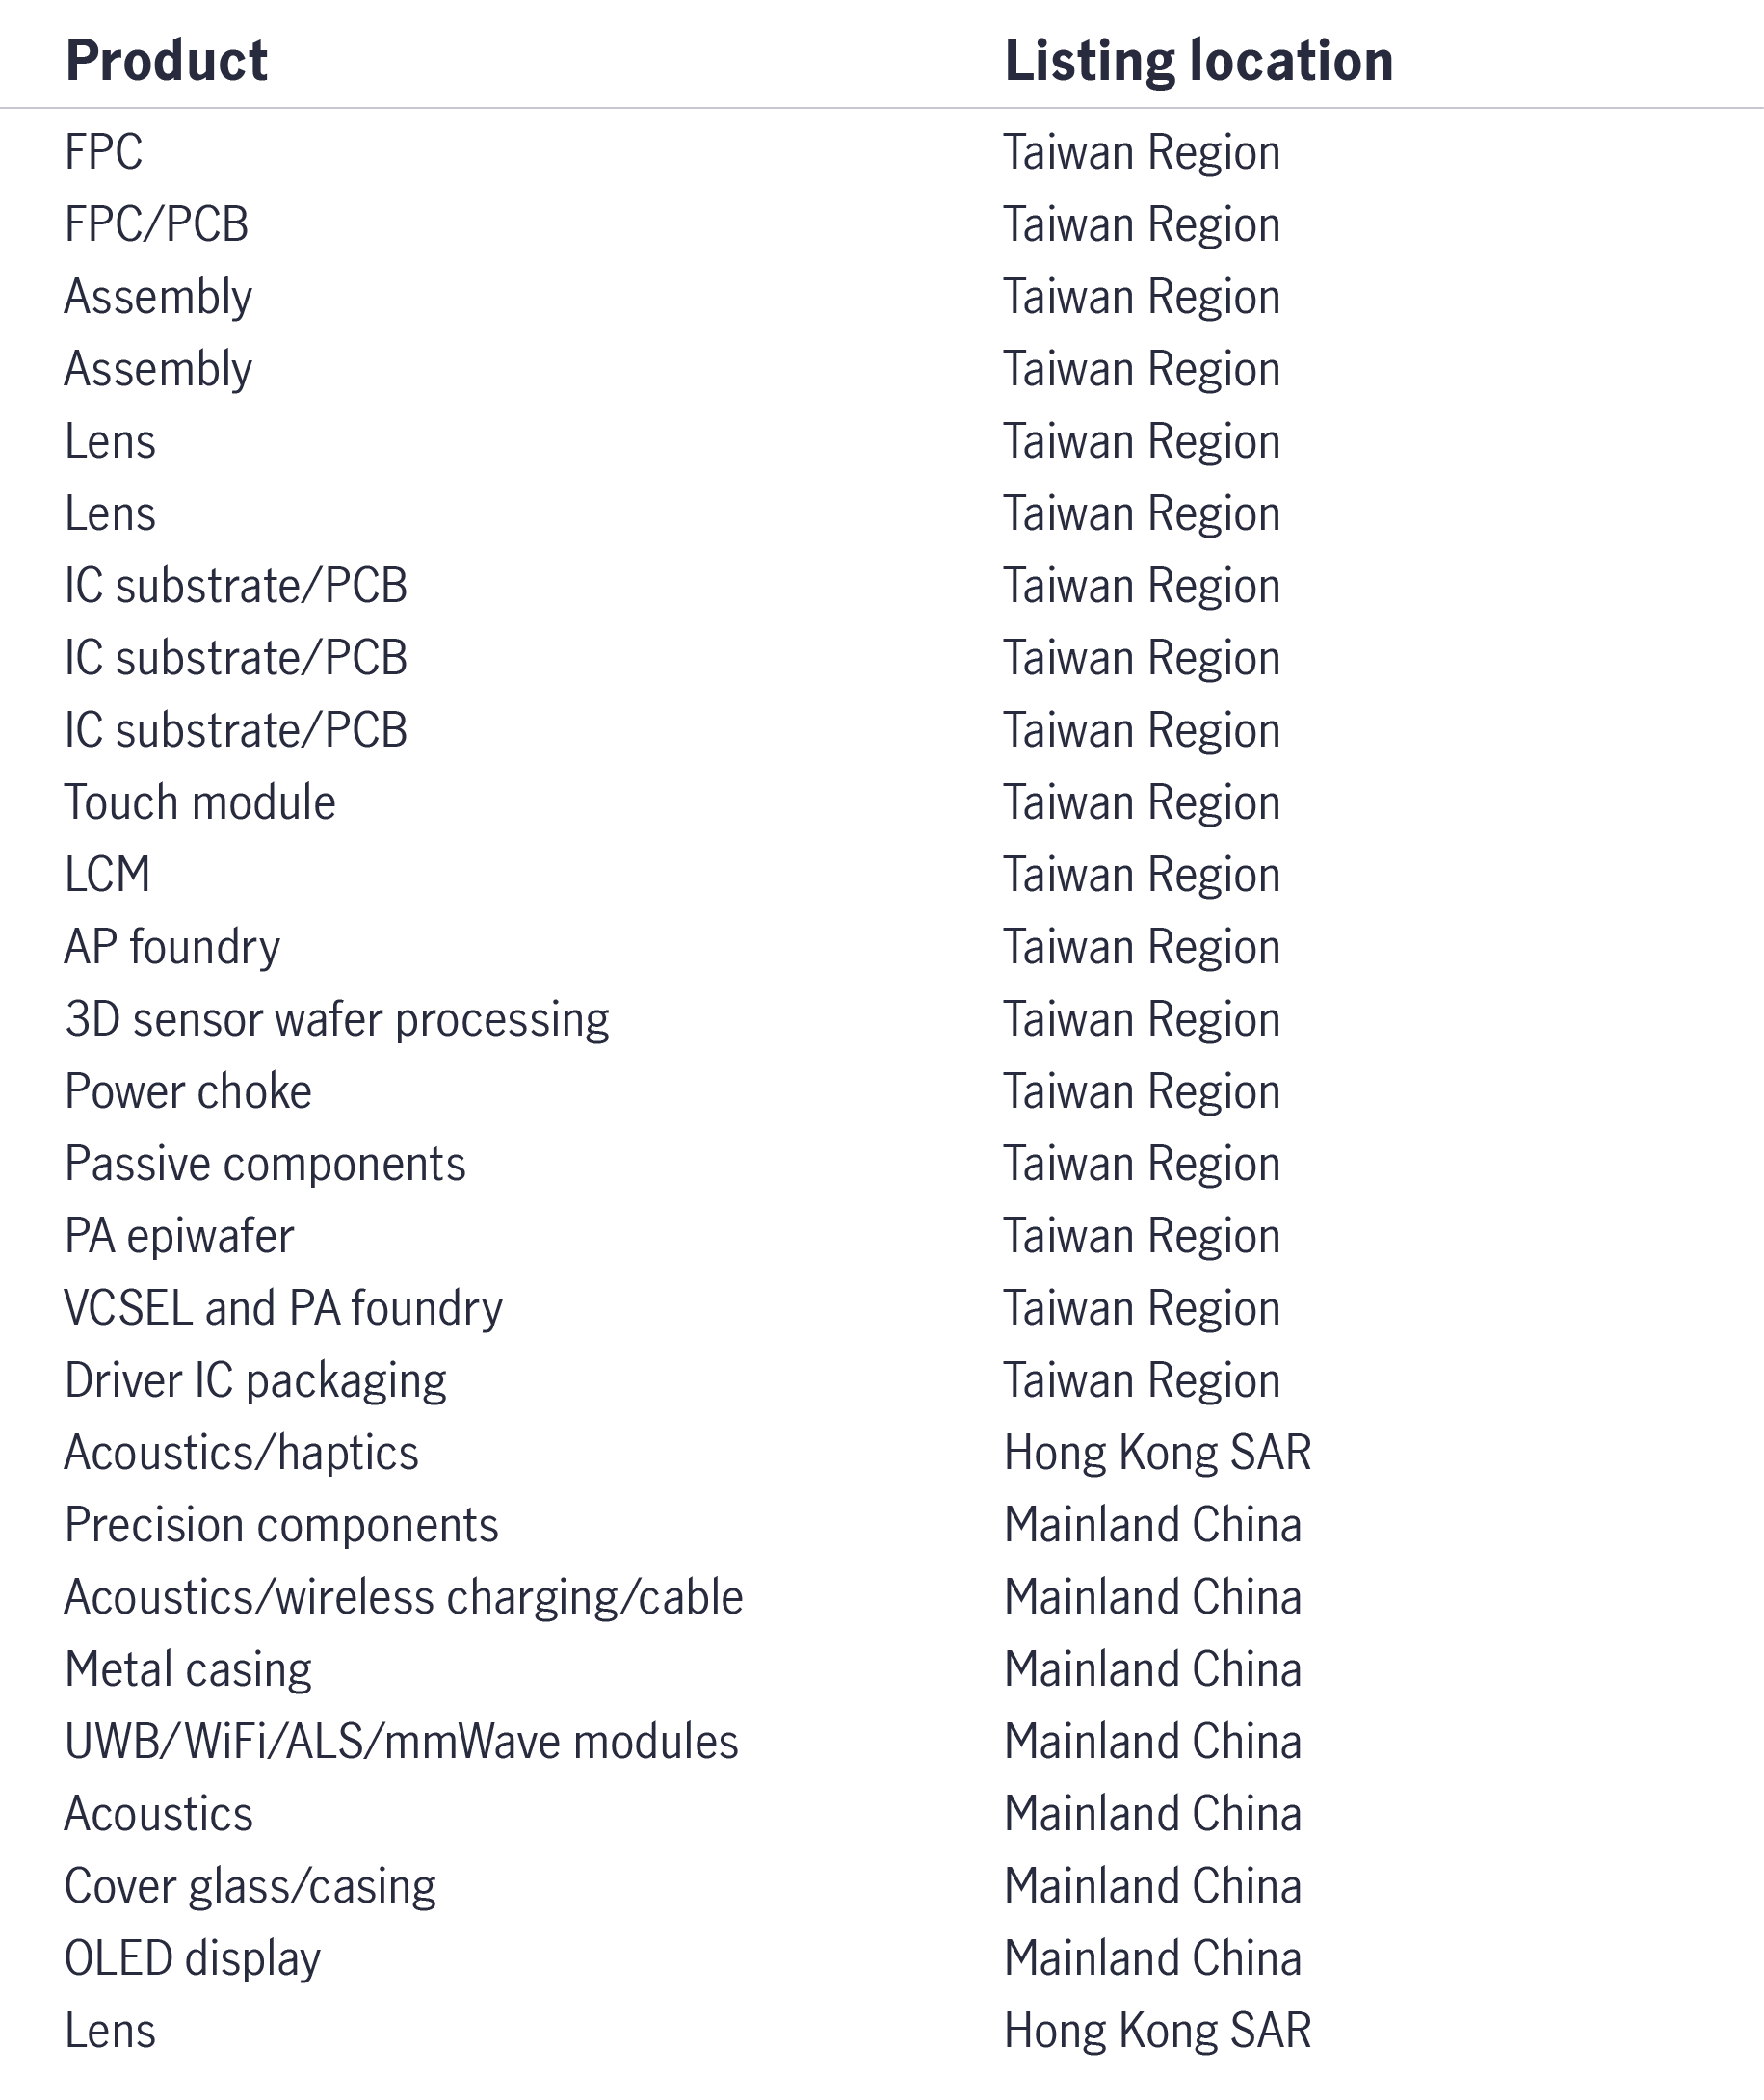
Furthermore, the smartphone supply chain benefits from (1) the global smartphone recovery and (2) the replacement cycle as leading technology companies roll out new AI-enabled applications. Going into 2025, mainland Chinese and Taiwanese smart phone component manufacturers will benefit from a global leading US smartphone’s replacement demand (see Chart 18).
Chart 18: Mainland Chinese and Taiwanese smart phone component manufacturers should benefit
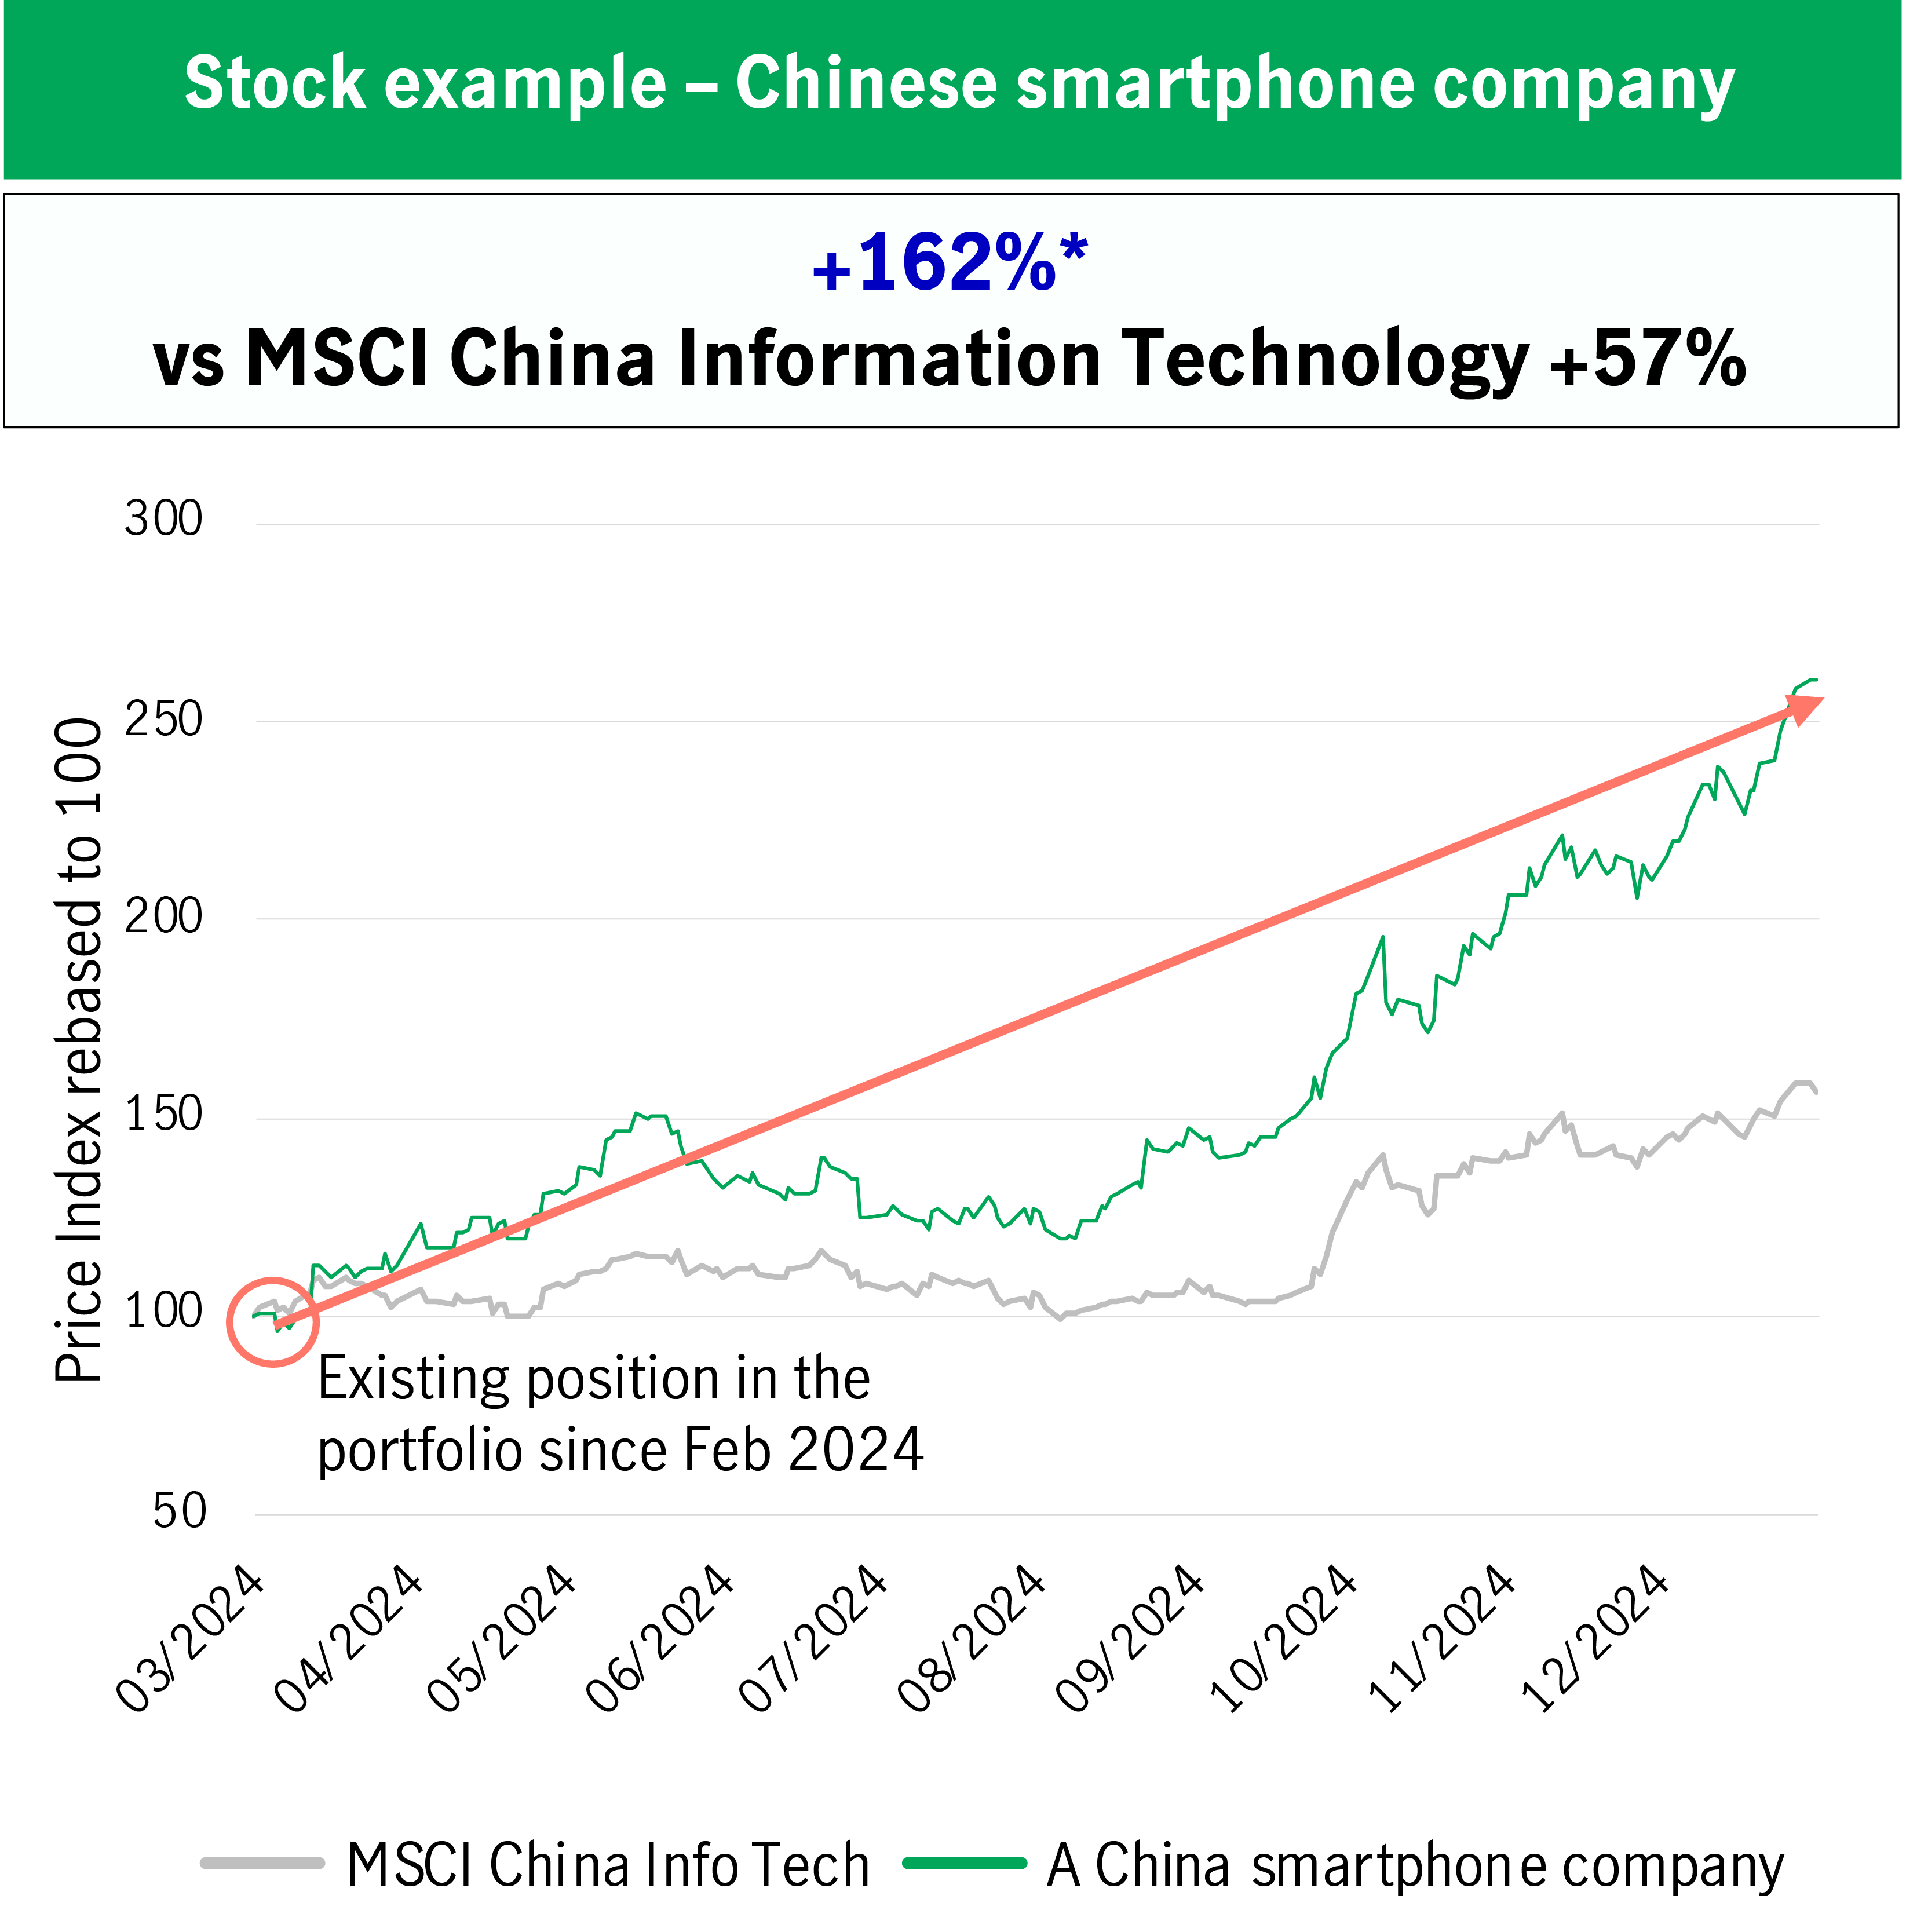
Below is an investment case of a mainland Chinese smartphone leader with the integration of AI and autonomous driving via the GCMV plus catalyst lens:
Investment case: A mainland Chinese smartphone company
Growth (G) |
|
| Cash Flow (C) |
|
Management (M) |
|
| Valuation (V) |
|
| Catalyst (Catalyst) |
|
Chart 19: A Chinese smartphone company outperformed
Autonomous driving2
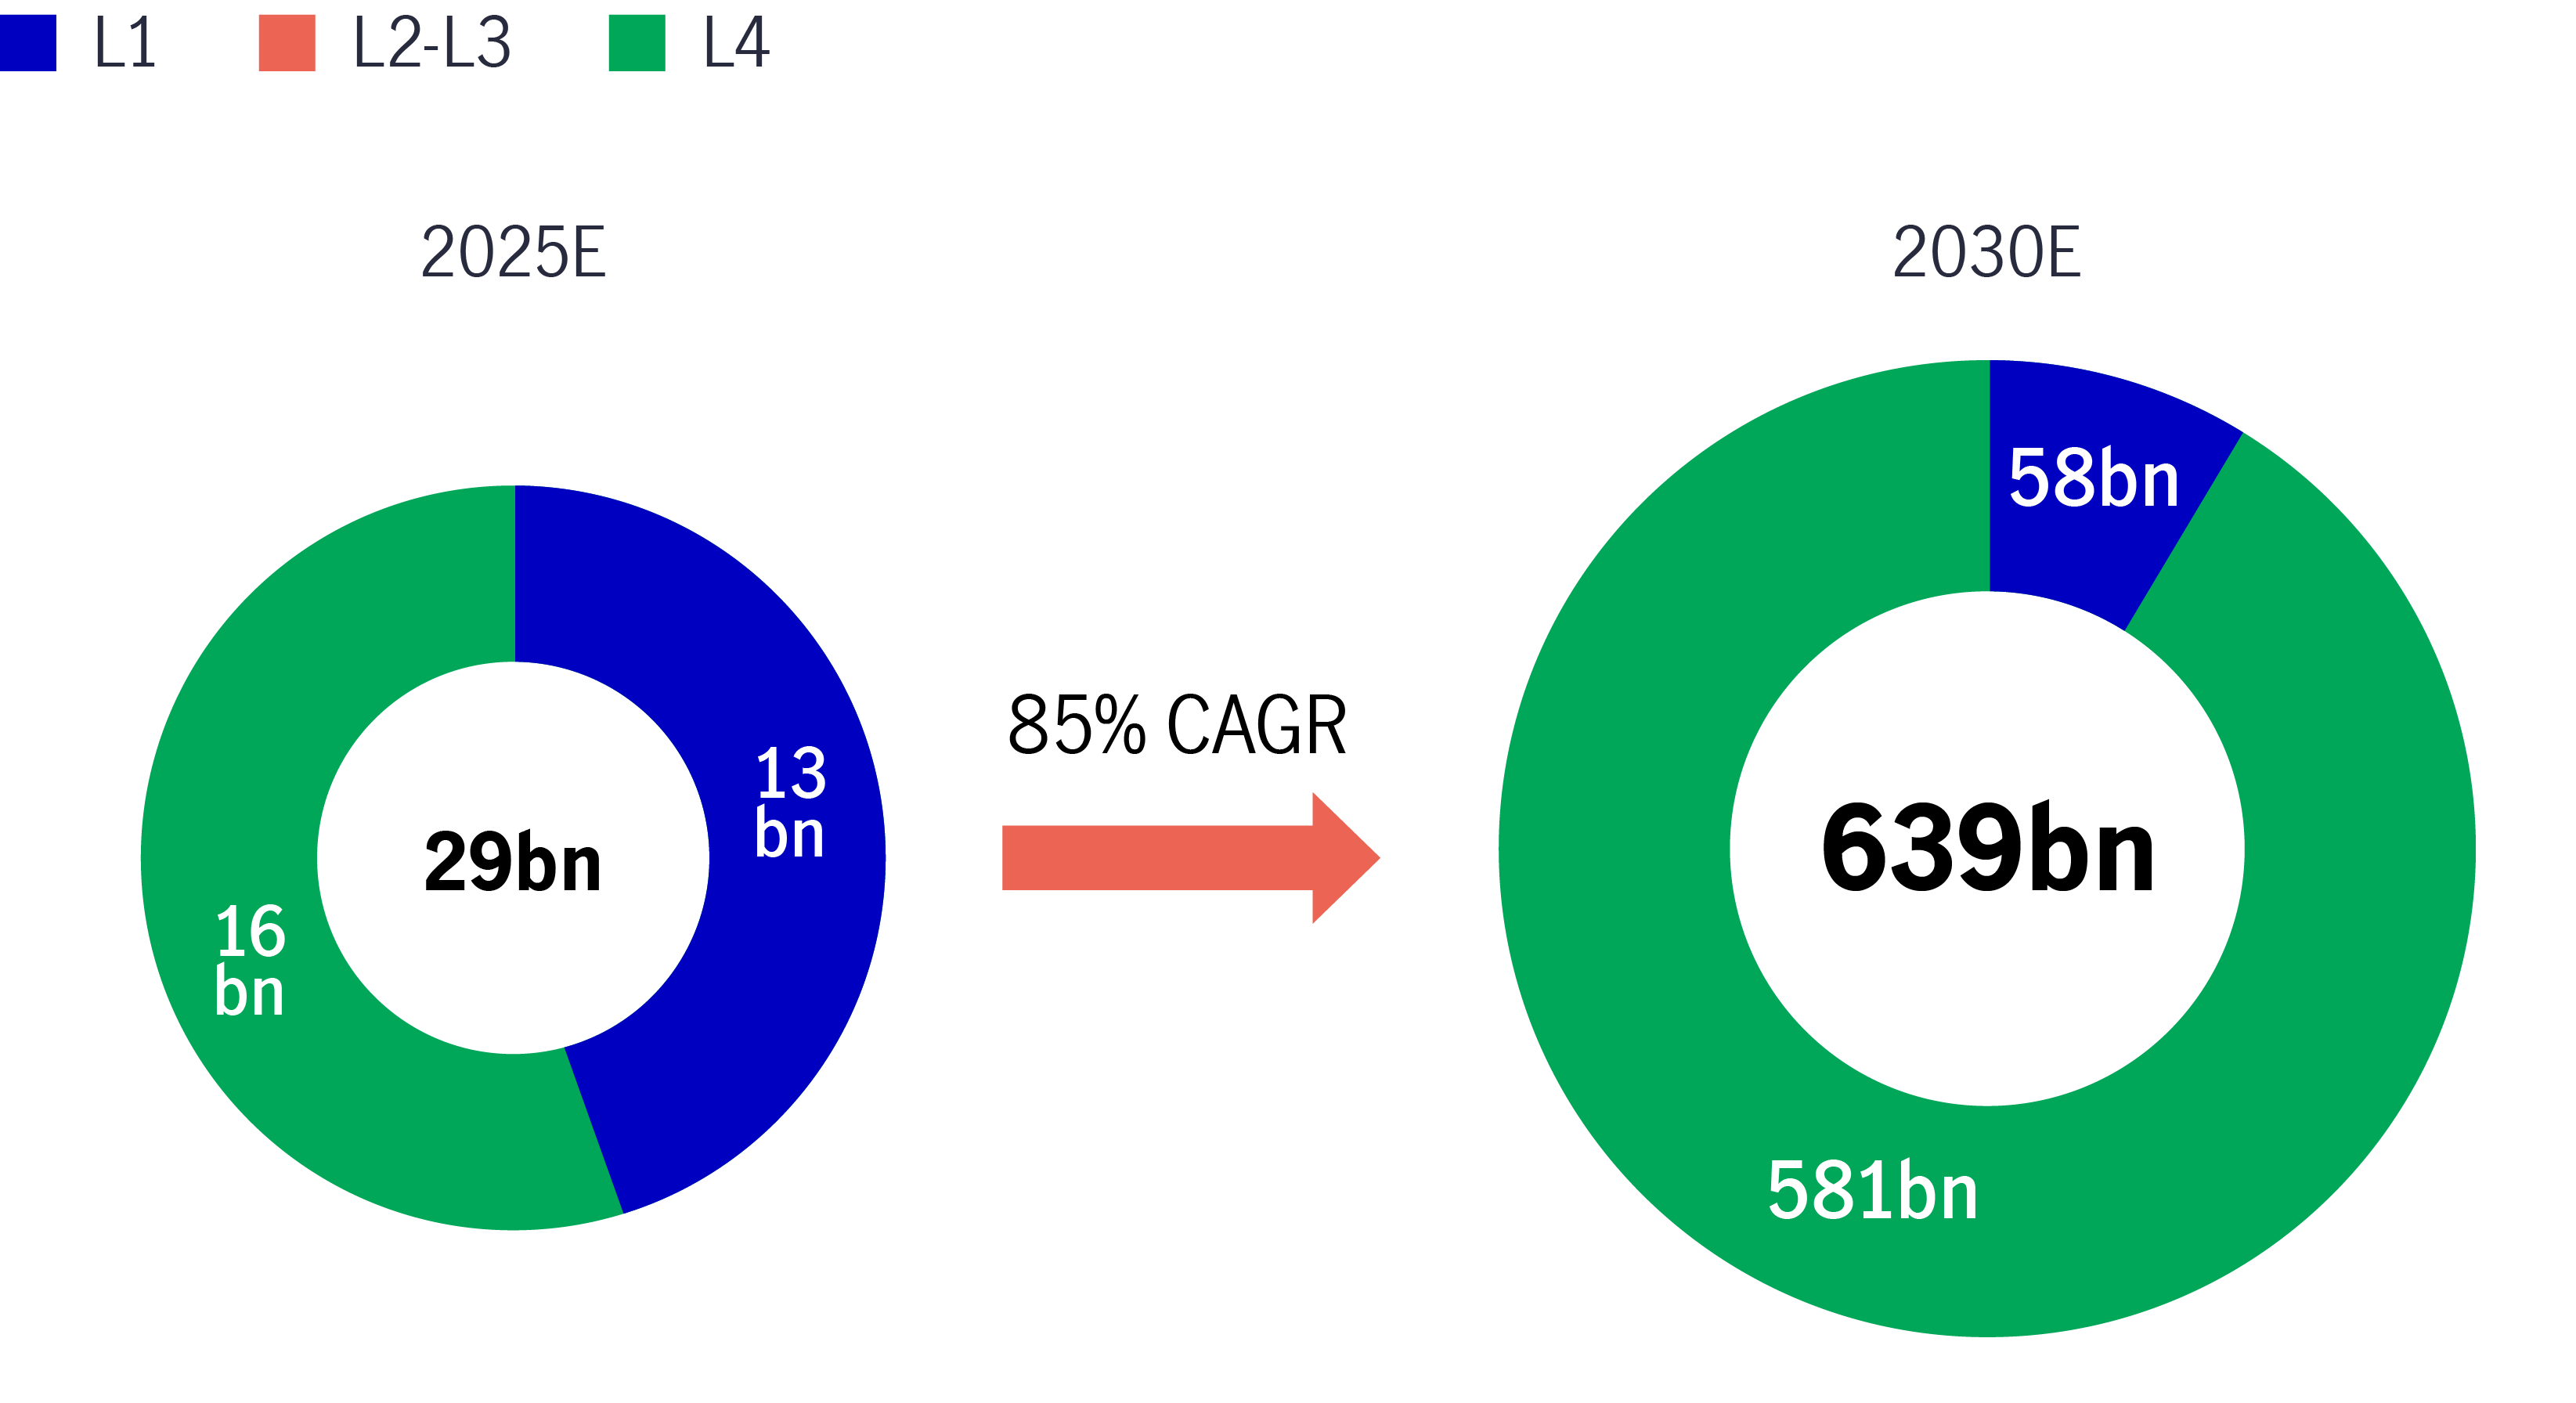
Autonomous vehicles are beneficiaries of Edge AI development. According to China Insights Consultancy (CIC), mainland China’s autonomous driving market size is forecast to grow at an 85% compound annual growth rate (CAGR) from USD 29 billion in 2025 to USD 639 billion in 2030 (see Chart 20).
Chart 20: Mainland China’s autonomous driving market size
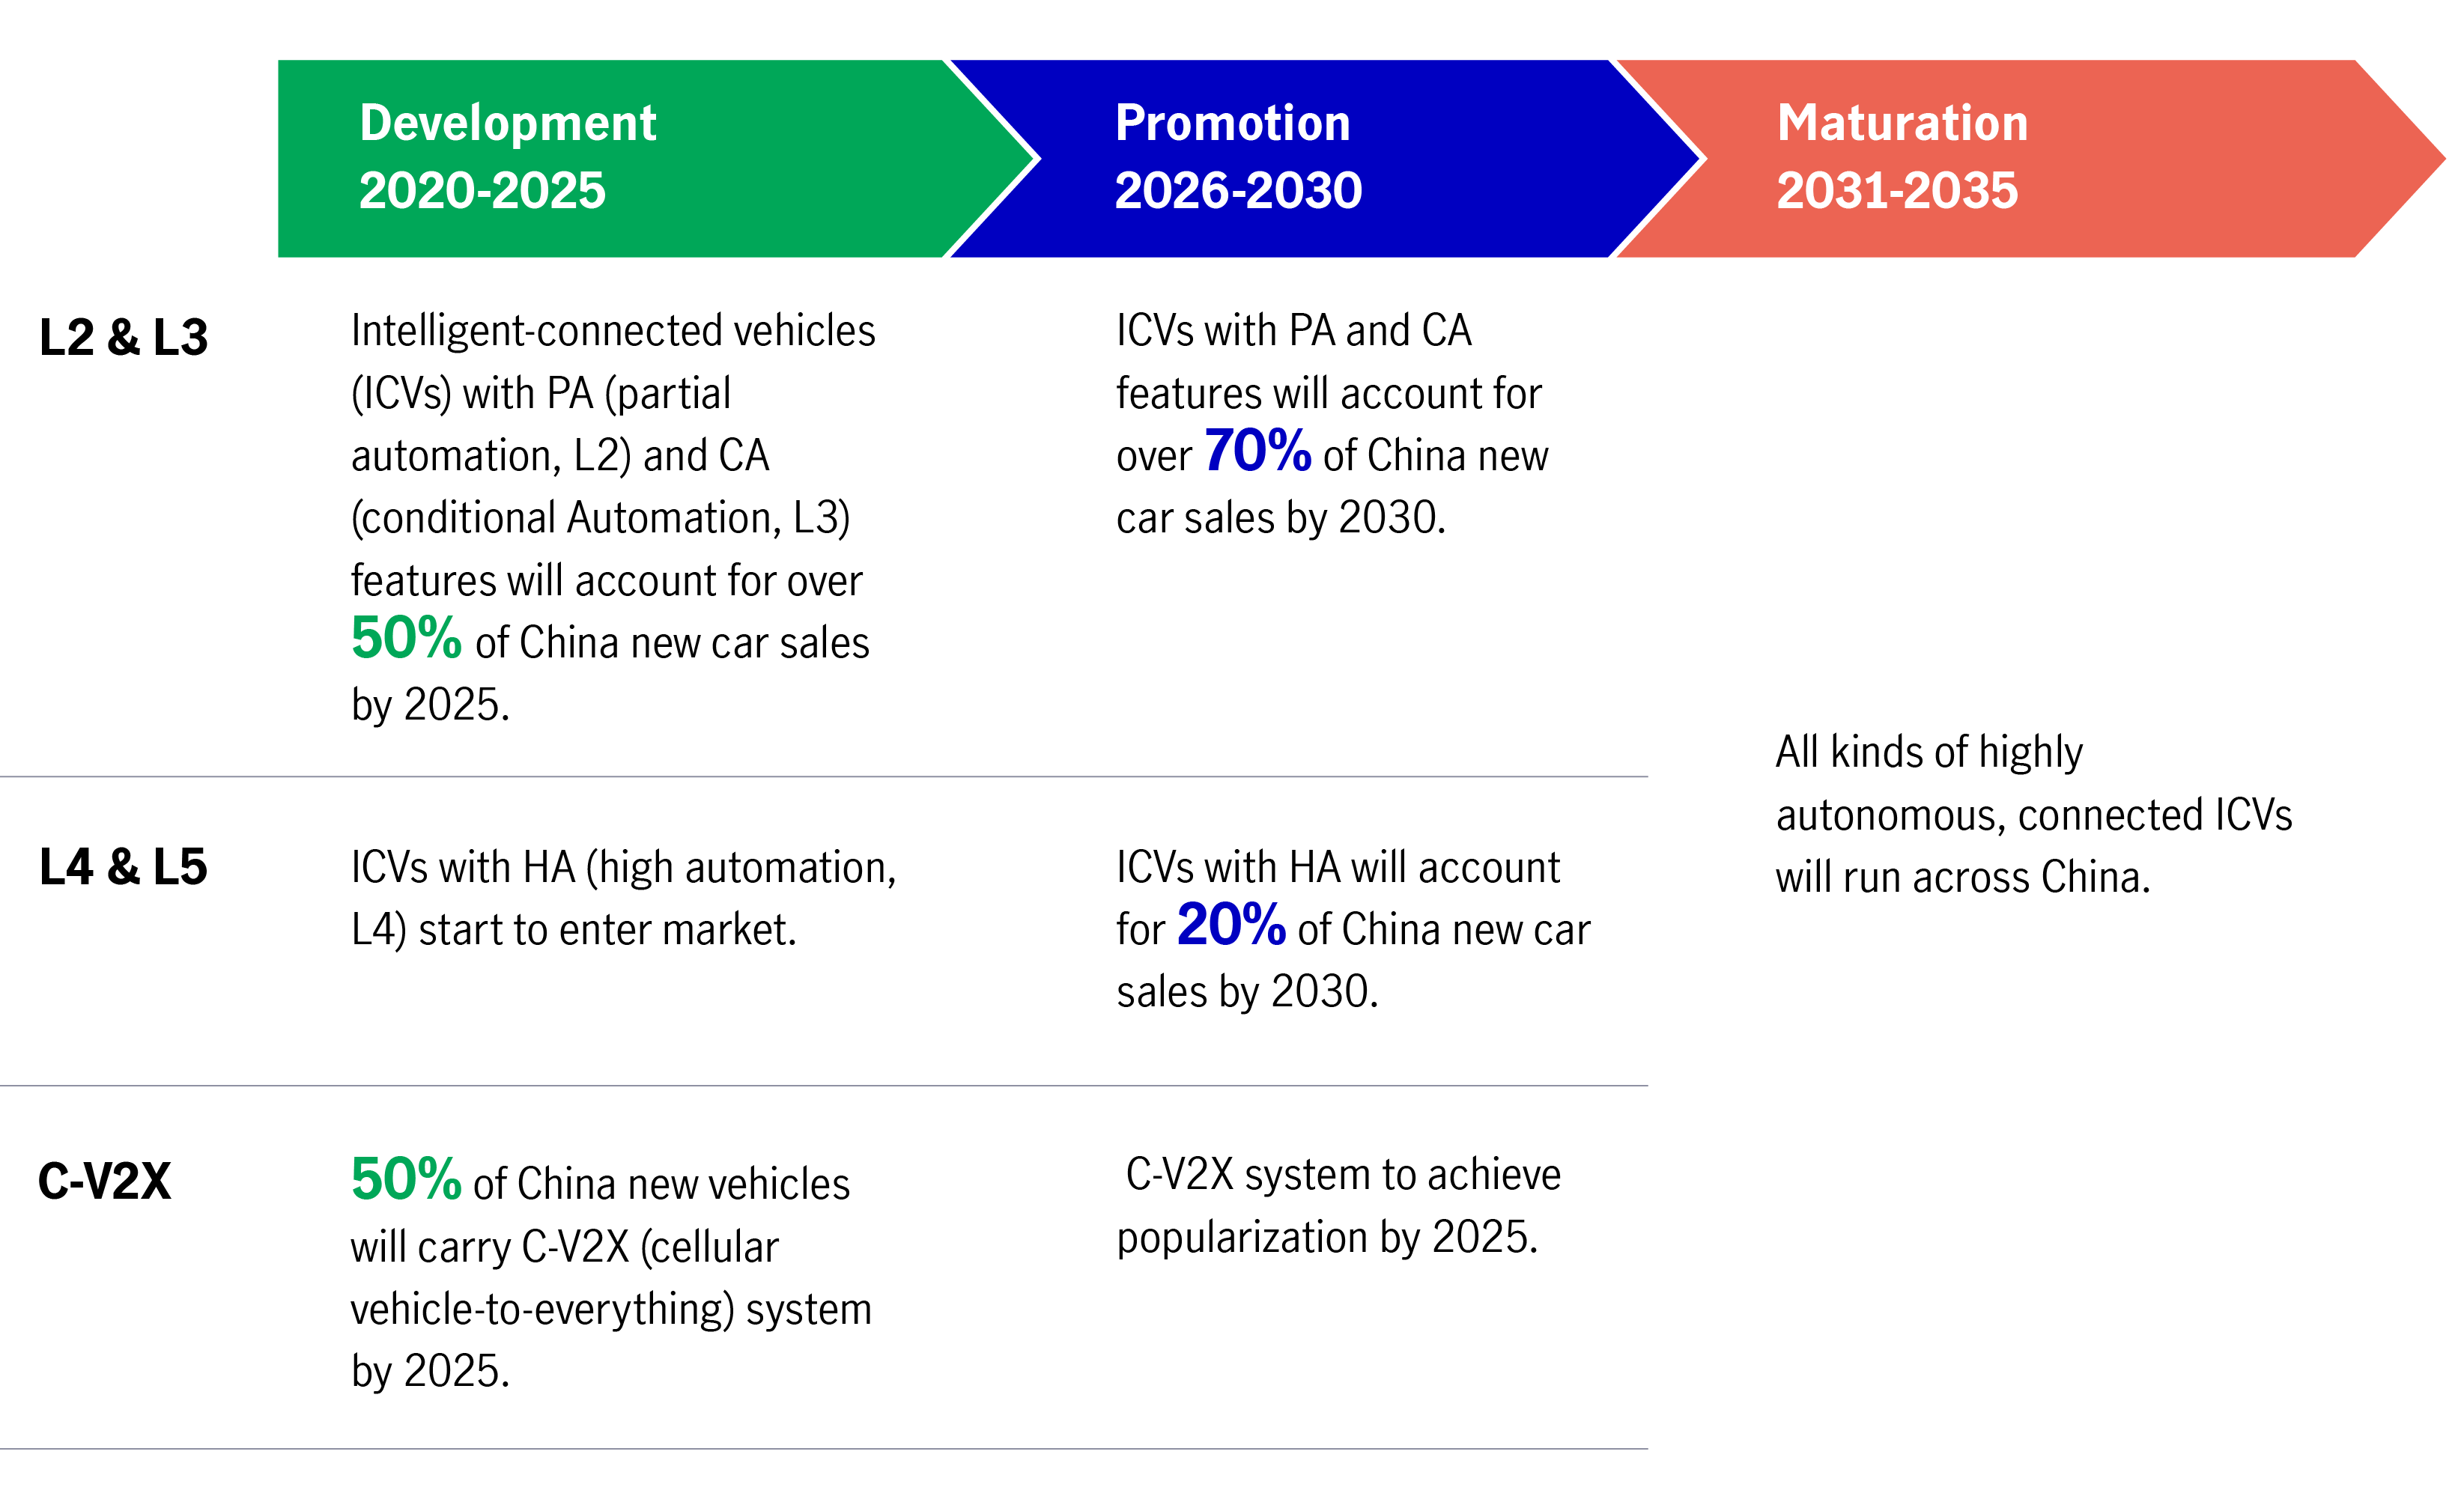
In terms of the technology roadmap (see Chart 21), it is forecast that intelligent-connected vehicles (ICVs) with partial automation (PA) L2 and conditional automation (CA), L3 features will account for over 50% of mainland China’s new car sales by 2025. ICVs with high automation L4 are estimated to account for 20% of mainland China’s overall new car sales by 2030.
Chart 21: Technology roadmap
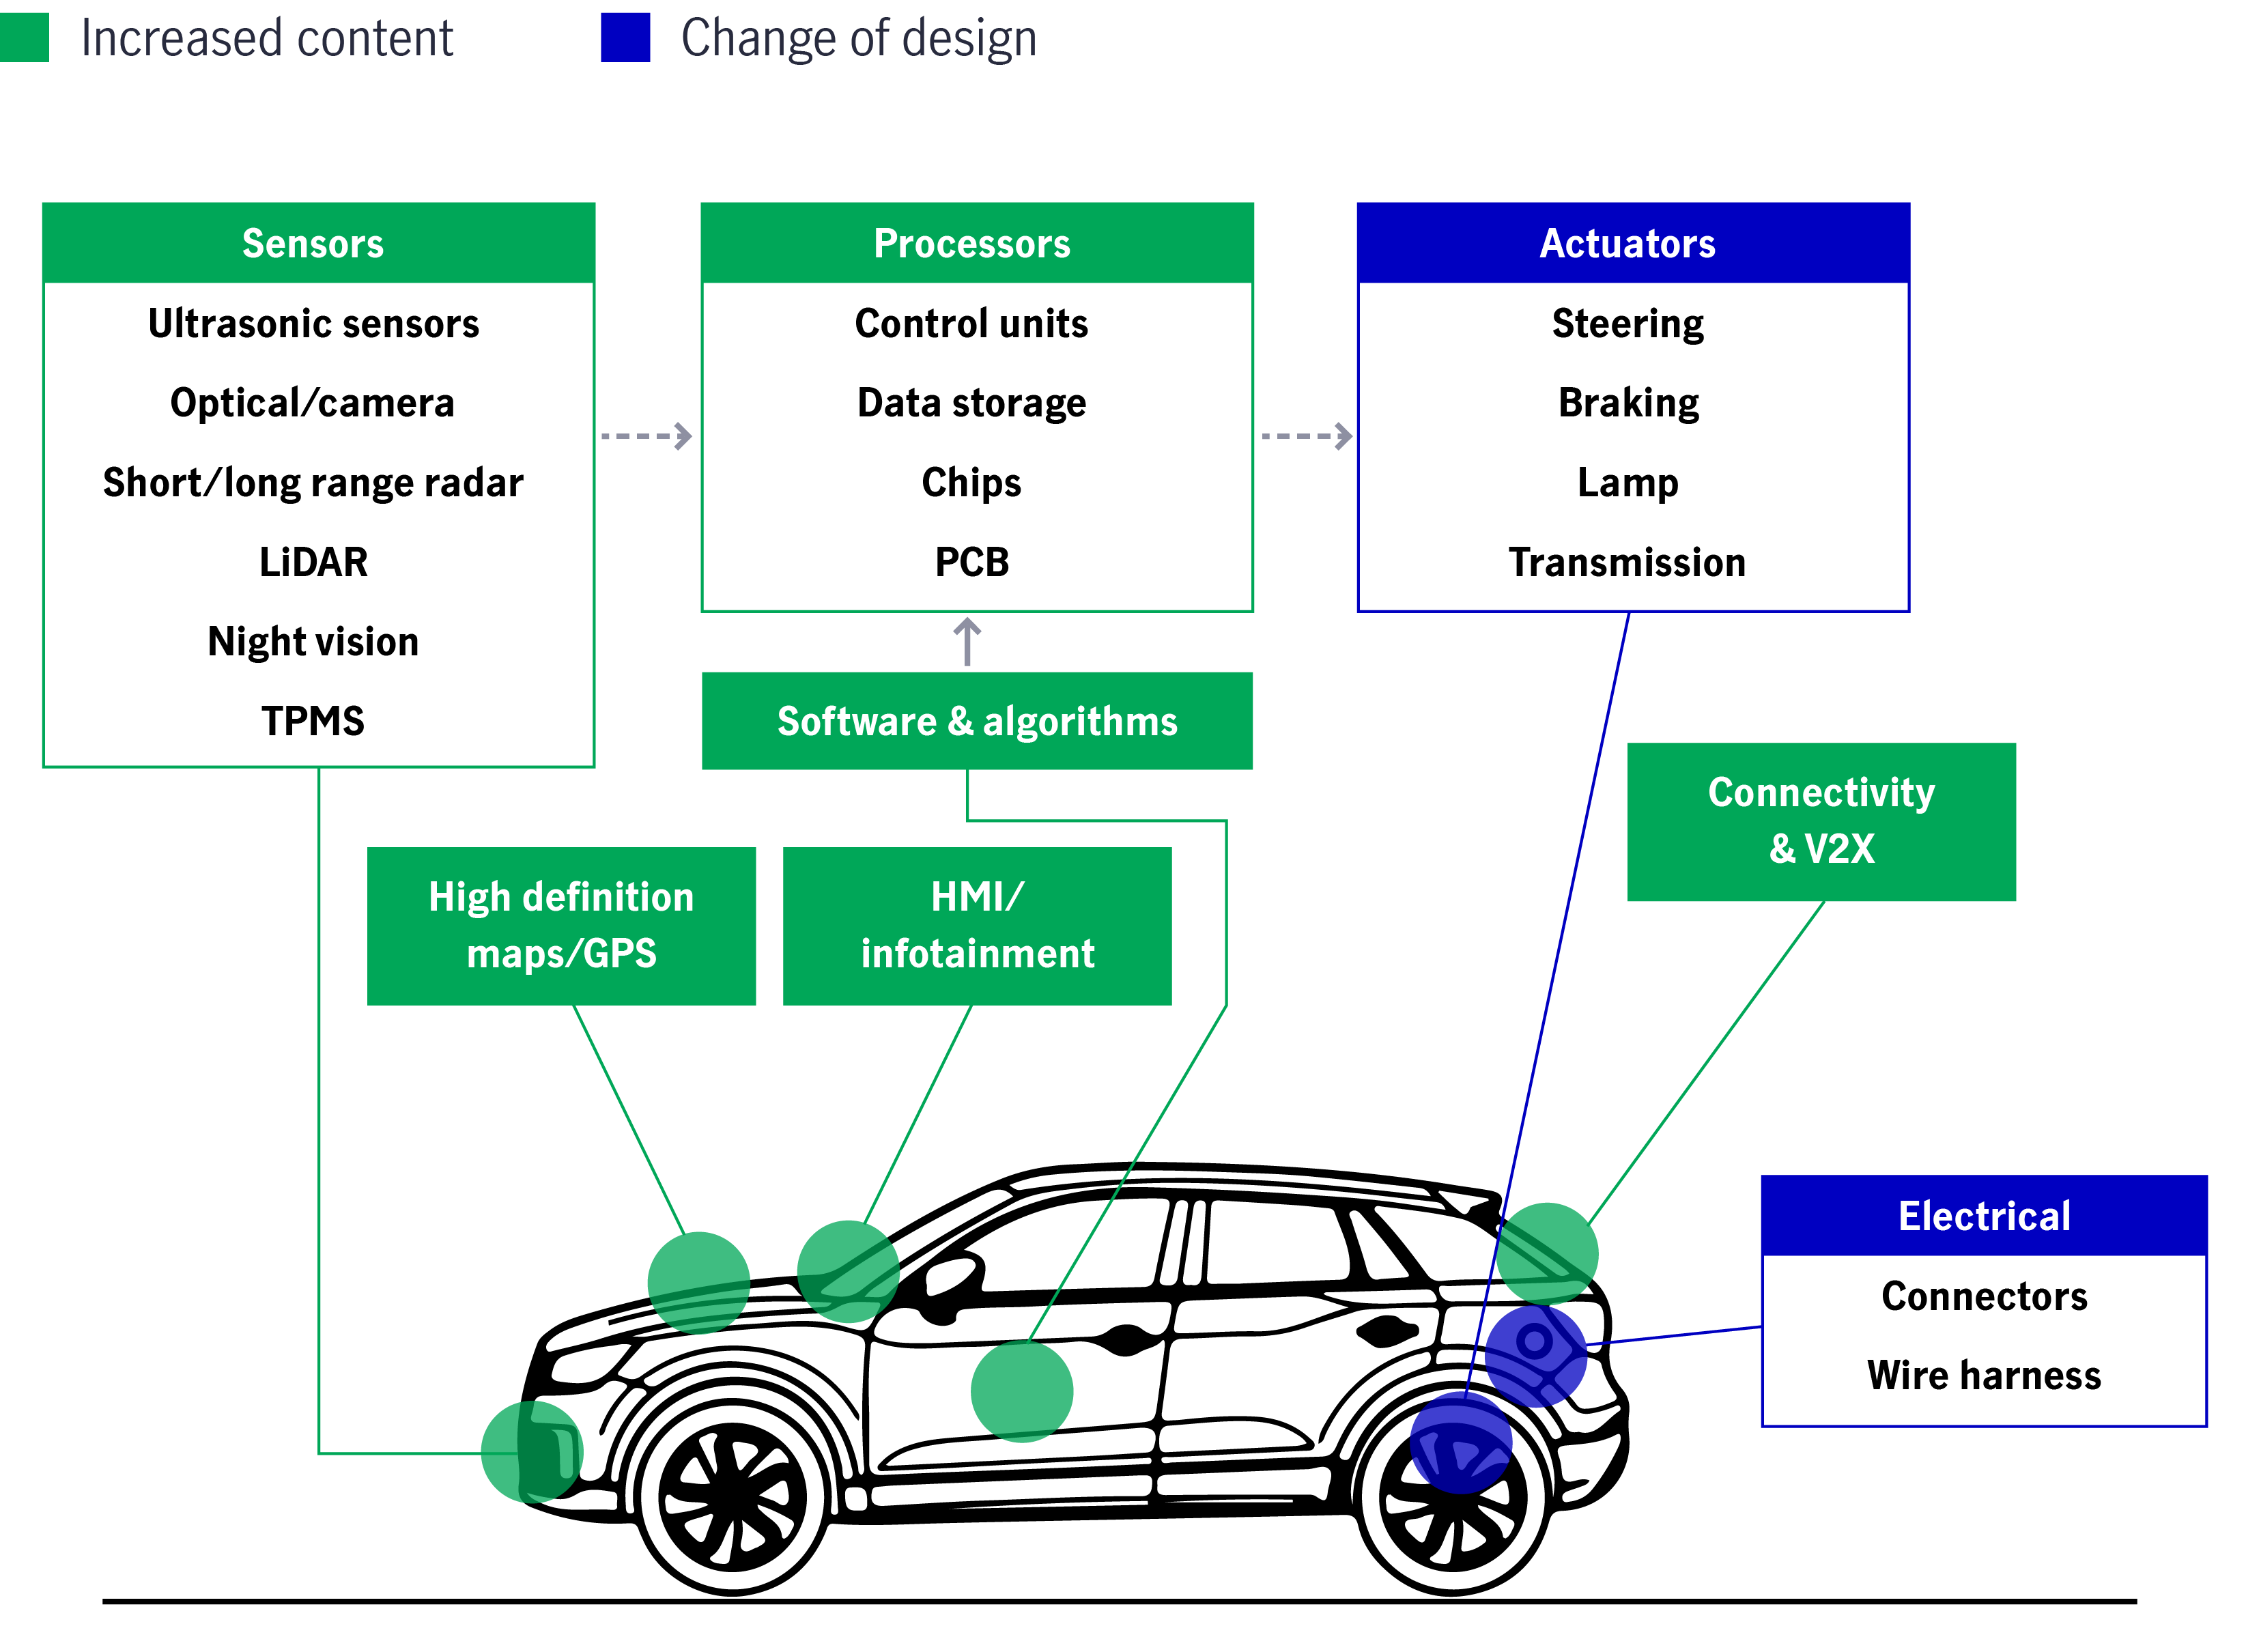
We believe that autonomous vehicle component manufacturers should benefit from the growth trends, and we favour component players – e.g. a system on a chip (SoC) that handles the data processing of vehicle sensors (i.e. drive without human interaction), auto original equipment manufacturers (OEMs), cameras and sensors, etc.
4th As – Automation
Investment in automation has generally bottomed in mainland China. Some sub-segments have recouped growth faster than others in 2024 due to a recovery in consumer sectors.
We prefer strong, advanced manufacturing leaders with robust research and development capabilities. These companies benefit from the domestic growth recovery while at the same time riding on overseas market strength due to strong pricing and margins in overseas markets.
Chart 22: Impact of autonomous driving
Conclusion
Despite the macro and geopolitical uncertainties that may lie ahead in 2025, Greater China is equipped to address the challenges with strong monetary and new fiscal policy initiatives. More demand-driven stimulus may be rolled out in 2025 to support the economy.
The country remains on the pathway to accelerate its technology roadmap while building domestic capabilities via import substitution and boosting self-sufficiency.
We see structural growth opportunities, ranging from Edge AI and autonomous driving to advanced manufacturing. Domestically, corporates are valuing up while returning more returns to shareholders. We also see sleeping giants in niche consumption sectors, e.g. travel, online music, and education, which continue to be the driving force for the industries.
In terms of positioning, we reiterate a pro-growth stance while adopting a barbell approach (i.e. invest in companies with dividend growth potential/dividend companies with a strong ability to buy back) while investing in firms with structural growth opportunities.
In the next section, we detail our thoughts on Taiwan equities going into 2025.
Chart 23: MSCI China valuation
Going into 2025, we believe Taiwan Region’s economy will remain strong, driven by a robust export and technology cycle. That said, potential near-term challenges, such as trade slowdown and tariff risks, remain.
However, over the next few years, the next generation of AI supply chain, AI inference beneficiaries, the expansion of AI data centres, a recovery in traditional tech cycles and central processing unit (CPU) upgrades continue to present medium-to-long-term growth opportunities for Taiwan Region.
Chart 24: Taiwan Region’s GDP growth year-on-year
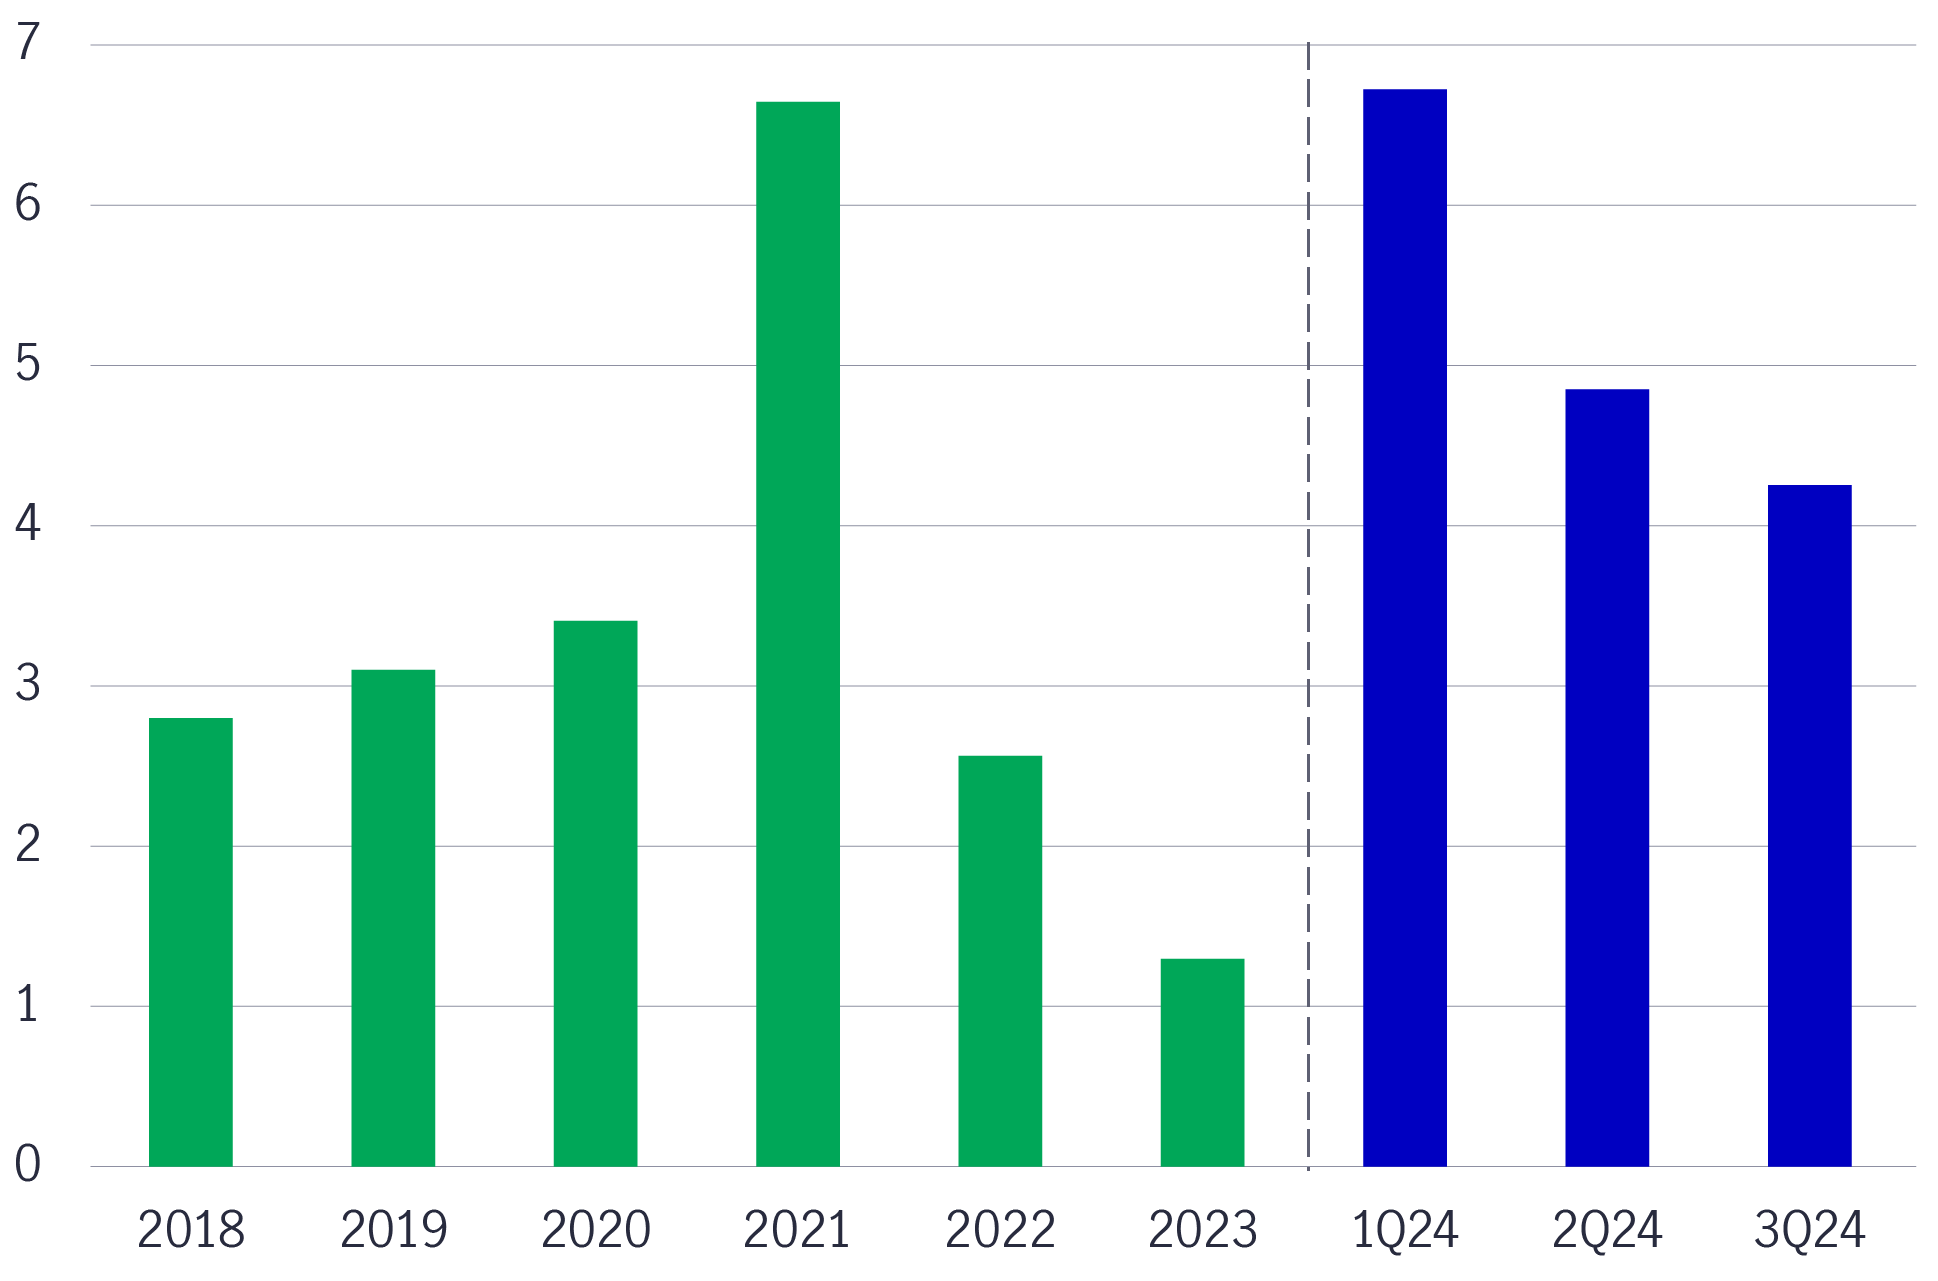
Chart 25: Taiwan Region’s trade balance and exports continue to improve, which boosts its trade surplus
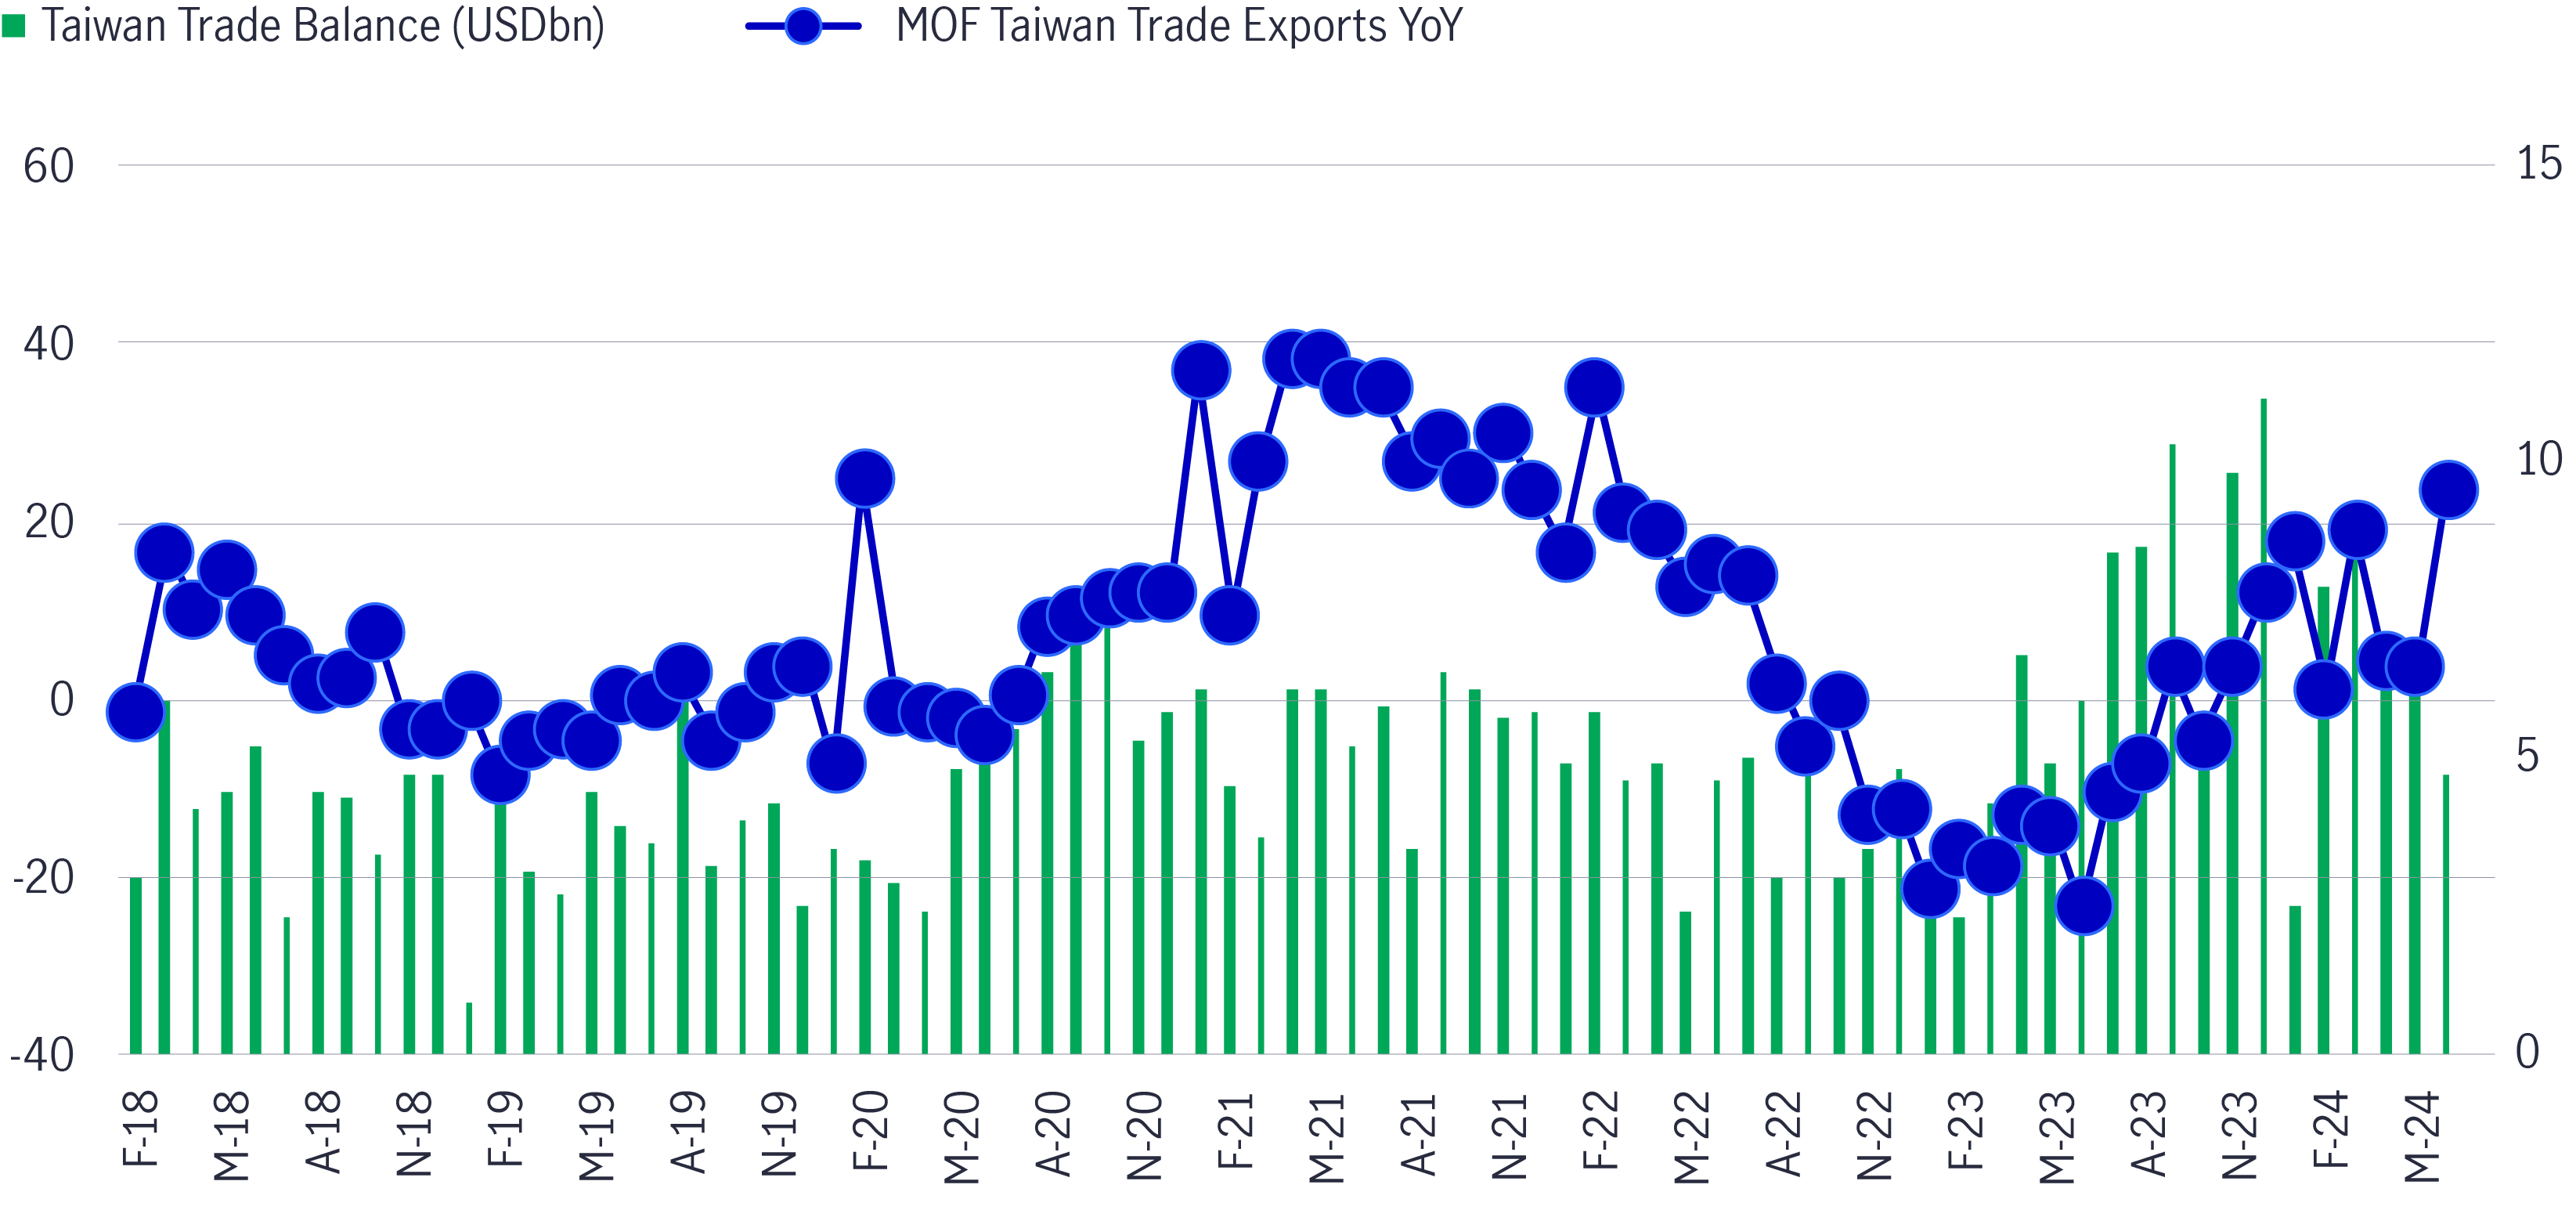
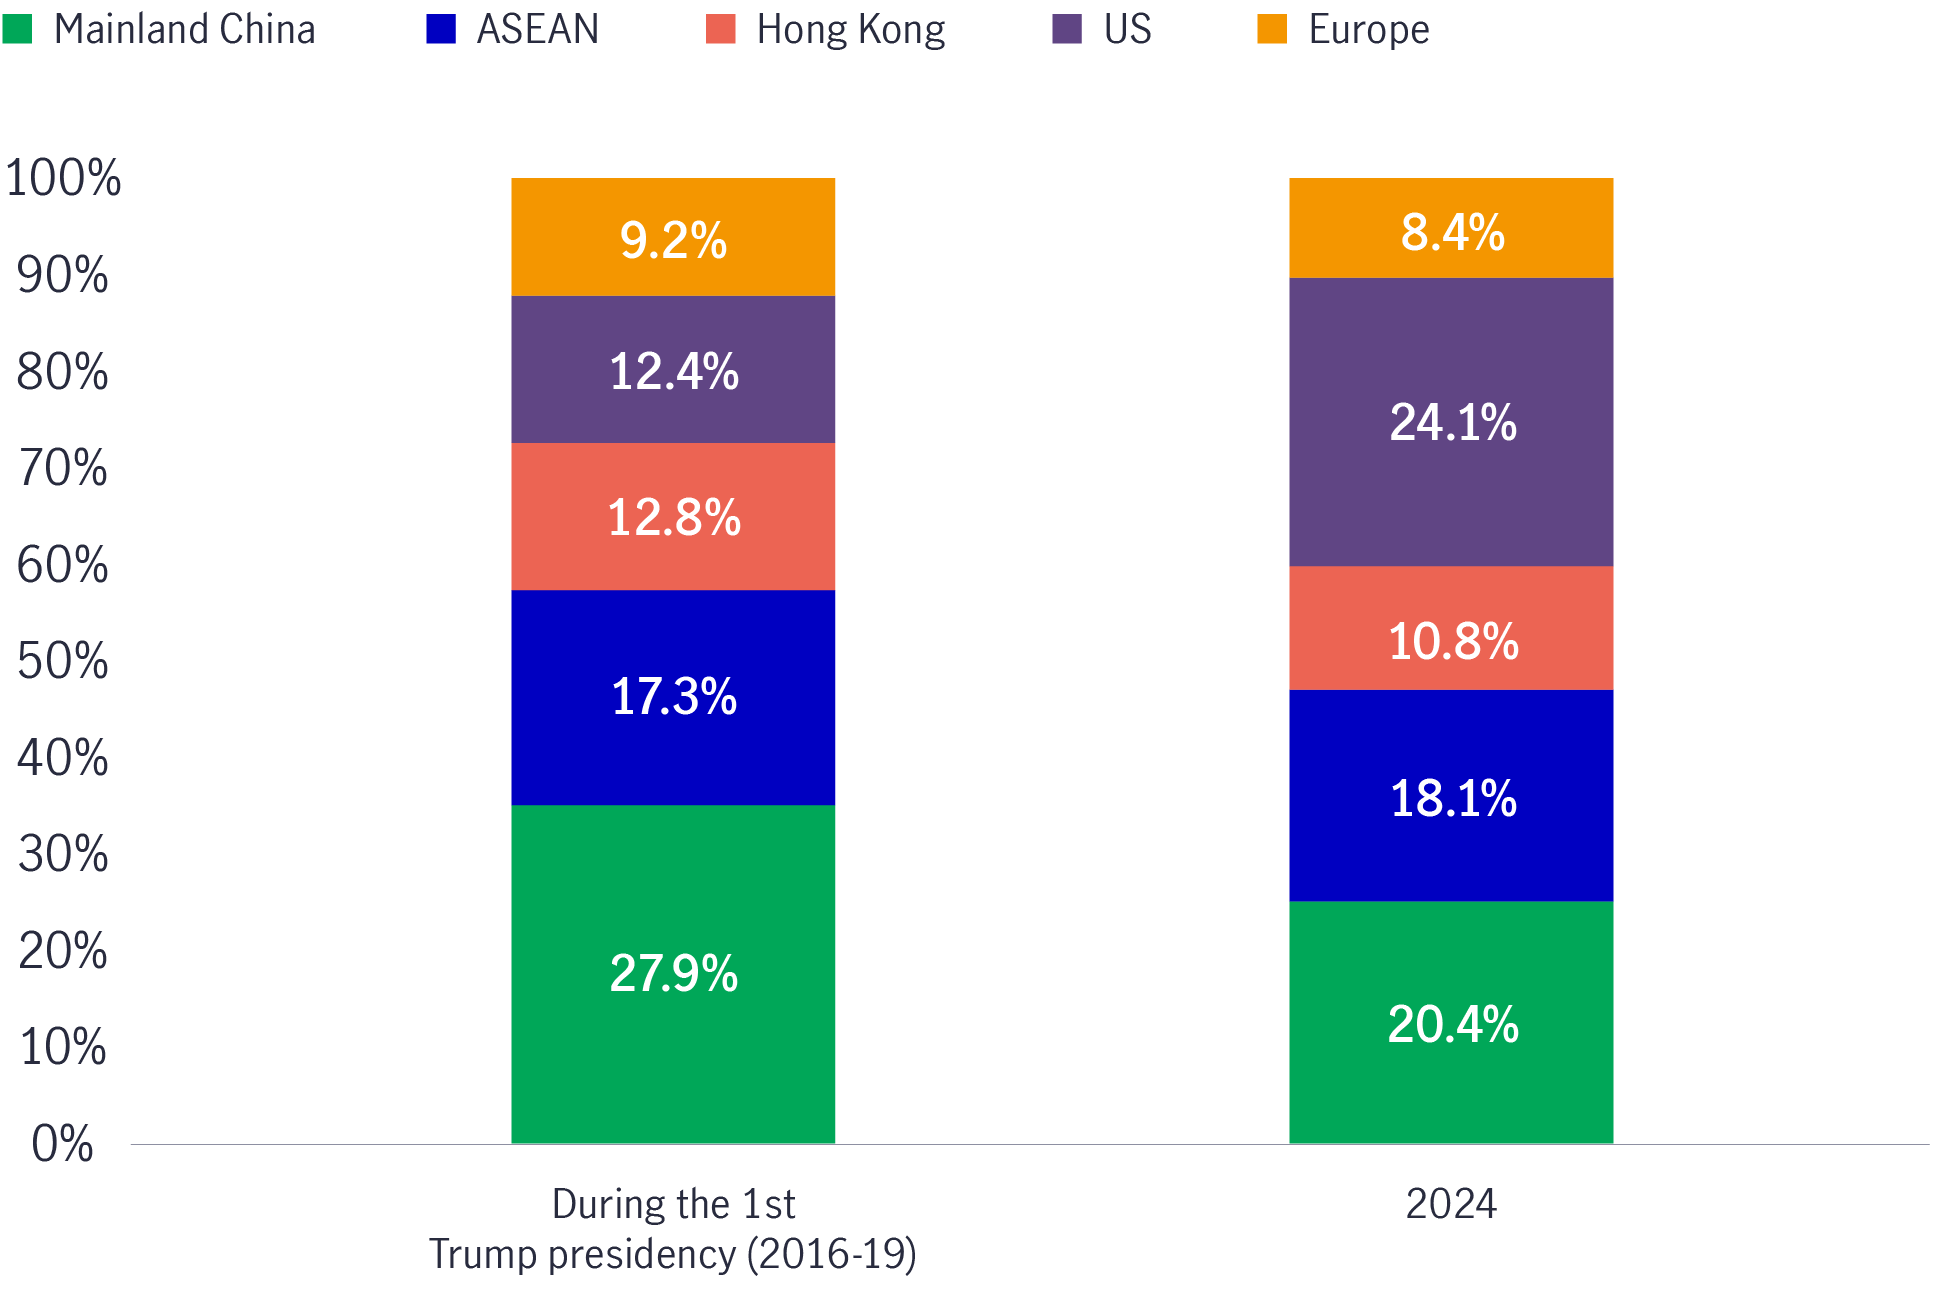
Potential tariffs over the next few years may impact the supply chain. However, over the past five years, Taiwan Region’s exports to the world have further diversified (i.e. exports to mainland China have reduced while exports to the US have increased significantly). For Taiwan Region, total investment in the US has also risen sharply, jumping to US$23 billion in 2023 from US$10 billion, on average, over the previous seven years due to re-investment in the US. In addition, Taiwanese companies’ capacities are globally diversified, which helps mitigate any risk factors. The potential downside risks are: (1) a slowdown in global information technology (IT) capital expenditure and AI demand.
Chart 26: Taiwan Region: export to top five destinations (% share to total exports)
Regarding positioning, we remain overweight in information technology and underweight in non-tech sectors like insurance. The Taiwan equity investment team focuses on stock selection via the Growth, Cash, Management and Valuation (GCMV) + Catalyst lens and alpha generation via an overweight in mid-cap and small-cap names.
3rd A – Advancement
Foundries: Advanced nodes take all
Taiwan Region is a global leader in advanced node foundries and has a unique technology supply chain spanning the upstream (i.e. foundry), mid-stream and downstream sectors. Leading foundries are key beneficiaries of AI inference driven by strong growth from AI semiconductors, personal computers (PCs) and smartphones. A doubling of Chip on Wafer on Substrate (CoWoS) and hikes in the average selling price (of wafers due to increased orders from US customers also help fuel growth.
Next generation of the AI supply chain
We are still in the early years of a multi-year AI cycle and believe that the next generation of the AI supply chain continues to benefit from the trend.
The evolution of data centre infrastructure
The US$ 1 trillion installed base of general-purpose CPU data centre infrastructure is expected to be modernised to a new “graphics processing unit (GPU)-accelerated” computing paradigm. New types of data centres and AI factories are expanding the data centre footprint to US$ 2 trillion.
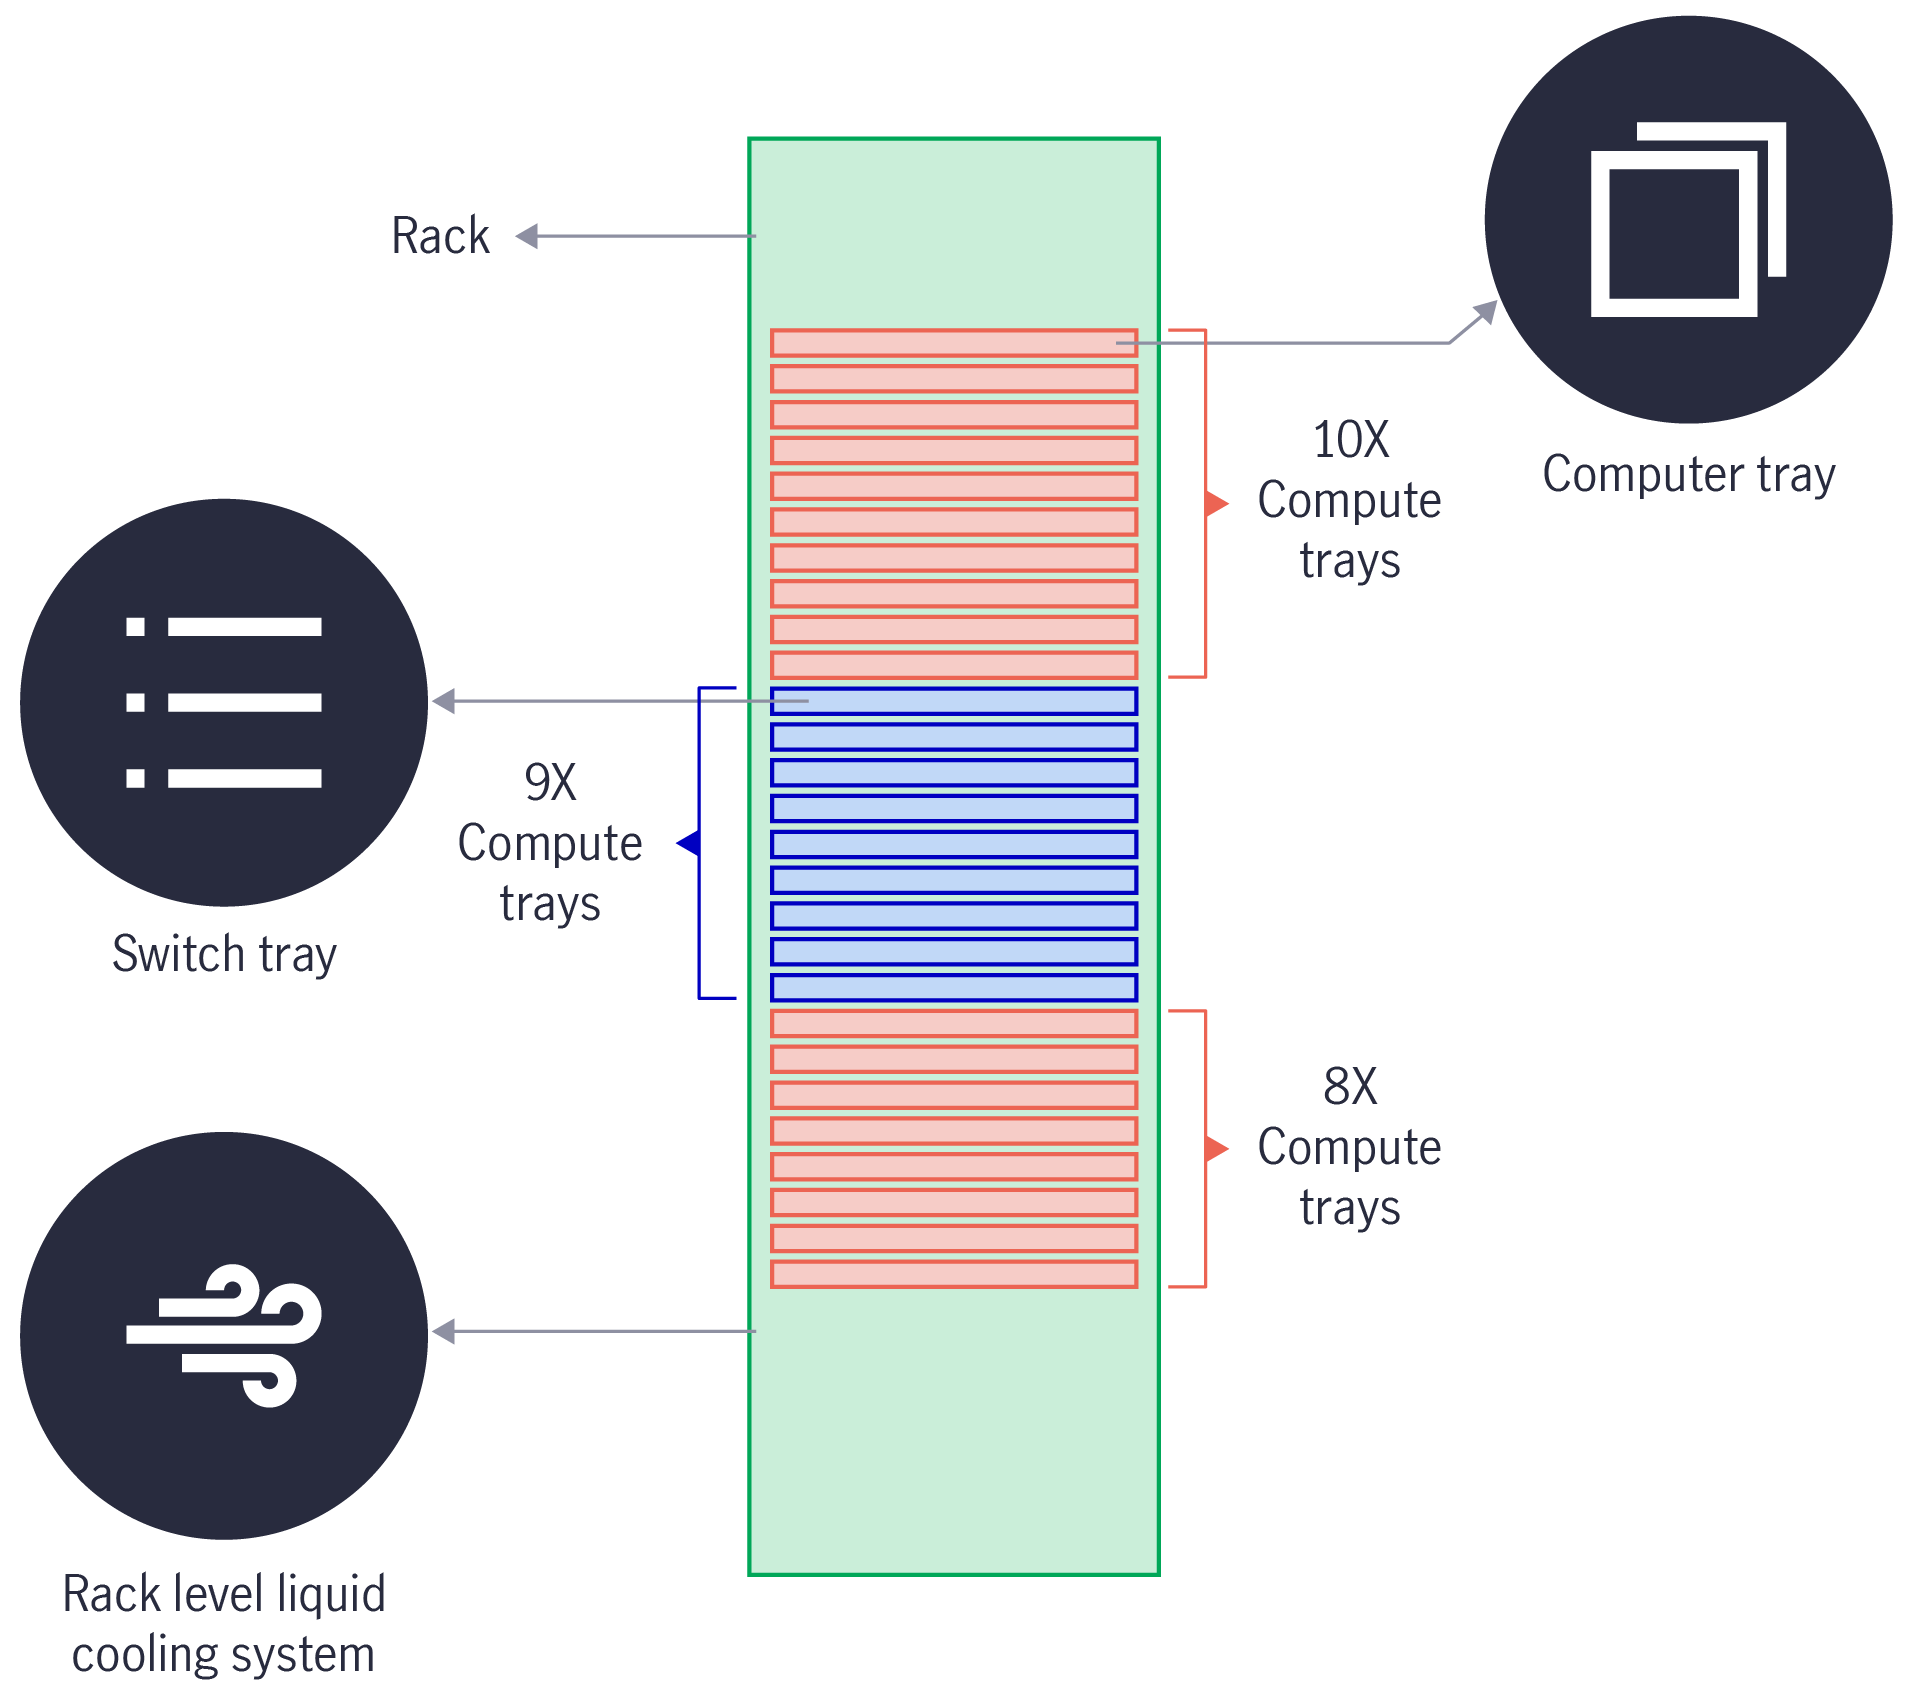
The demands of a leading US company’s product platform “B” allow corporates to run real-time generative AI on trillion-parameter large language models with up to 25x less cost and energy consumption than its predecessor. The new GPU architecture also enables accelerated computing, which will help unlock breakthroughs in data processing, engineering simulation, electronic design automation, computer-aided drug design, quantum computing and generative AI.
Chart 27: Accelerated computing
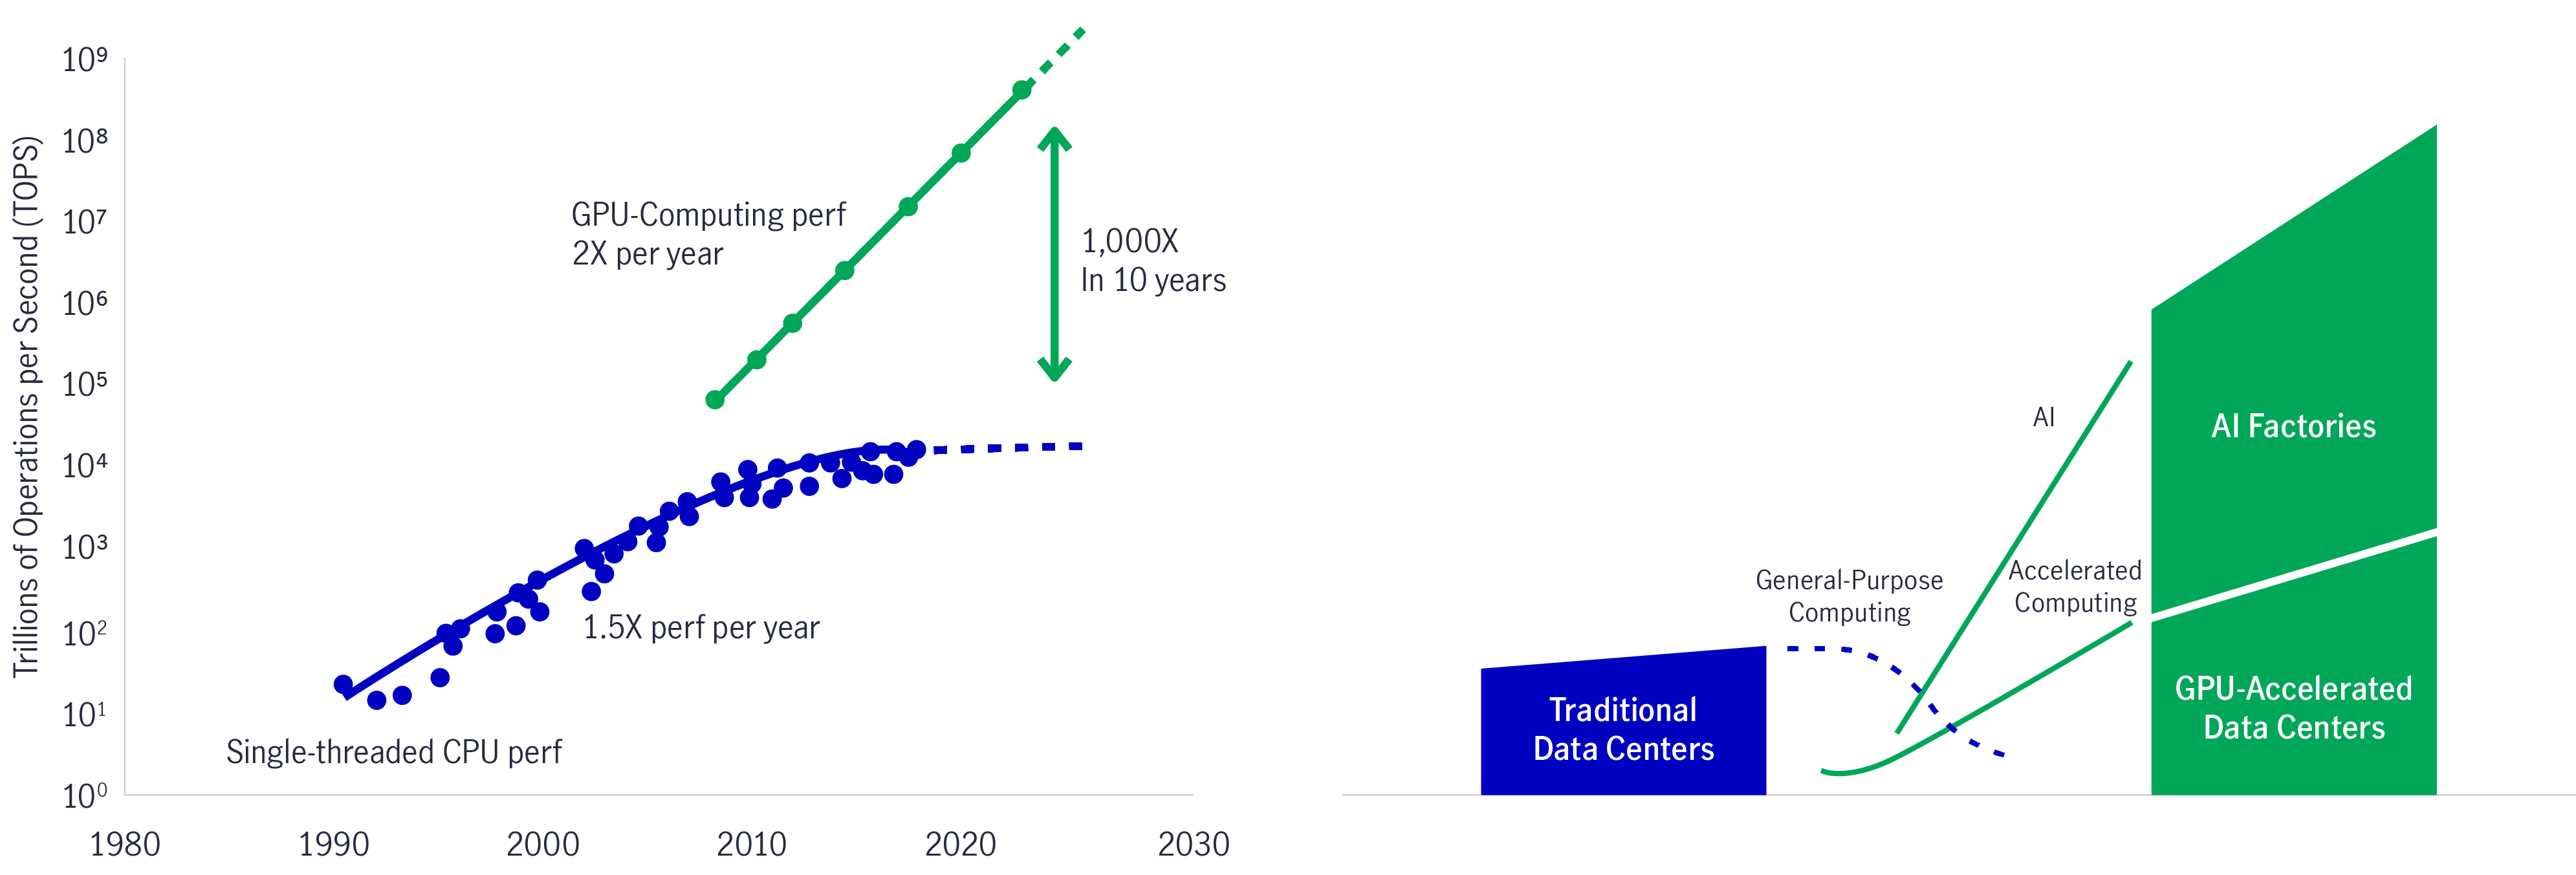
As a result, the adoption of accelerated computing is expected to create a wave of opportunities for component manufacturers, for example, concise common language (CCL), CPU and GPU substrates, printed circuit boards (PCB), computer boards, multi-node liquid-cooled, rack-scale system, and network switches, etc.
Chart 28: A world-leading US semi company’s major product supply chain
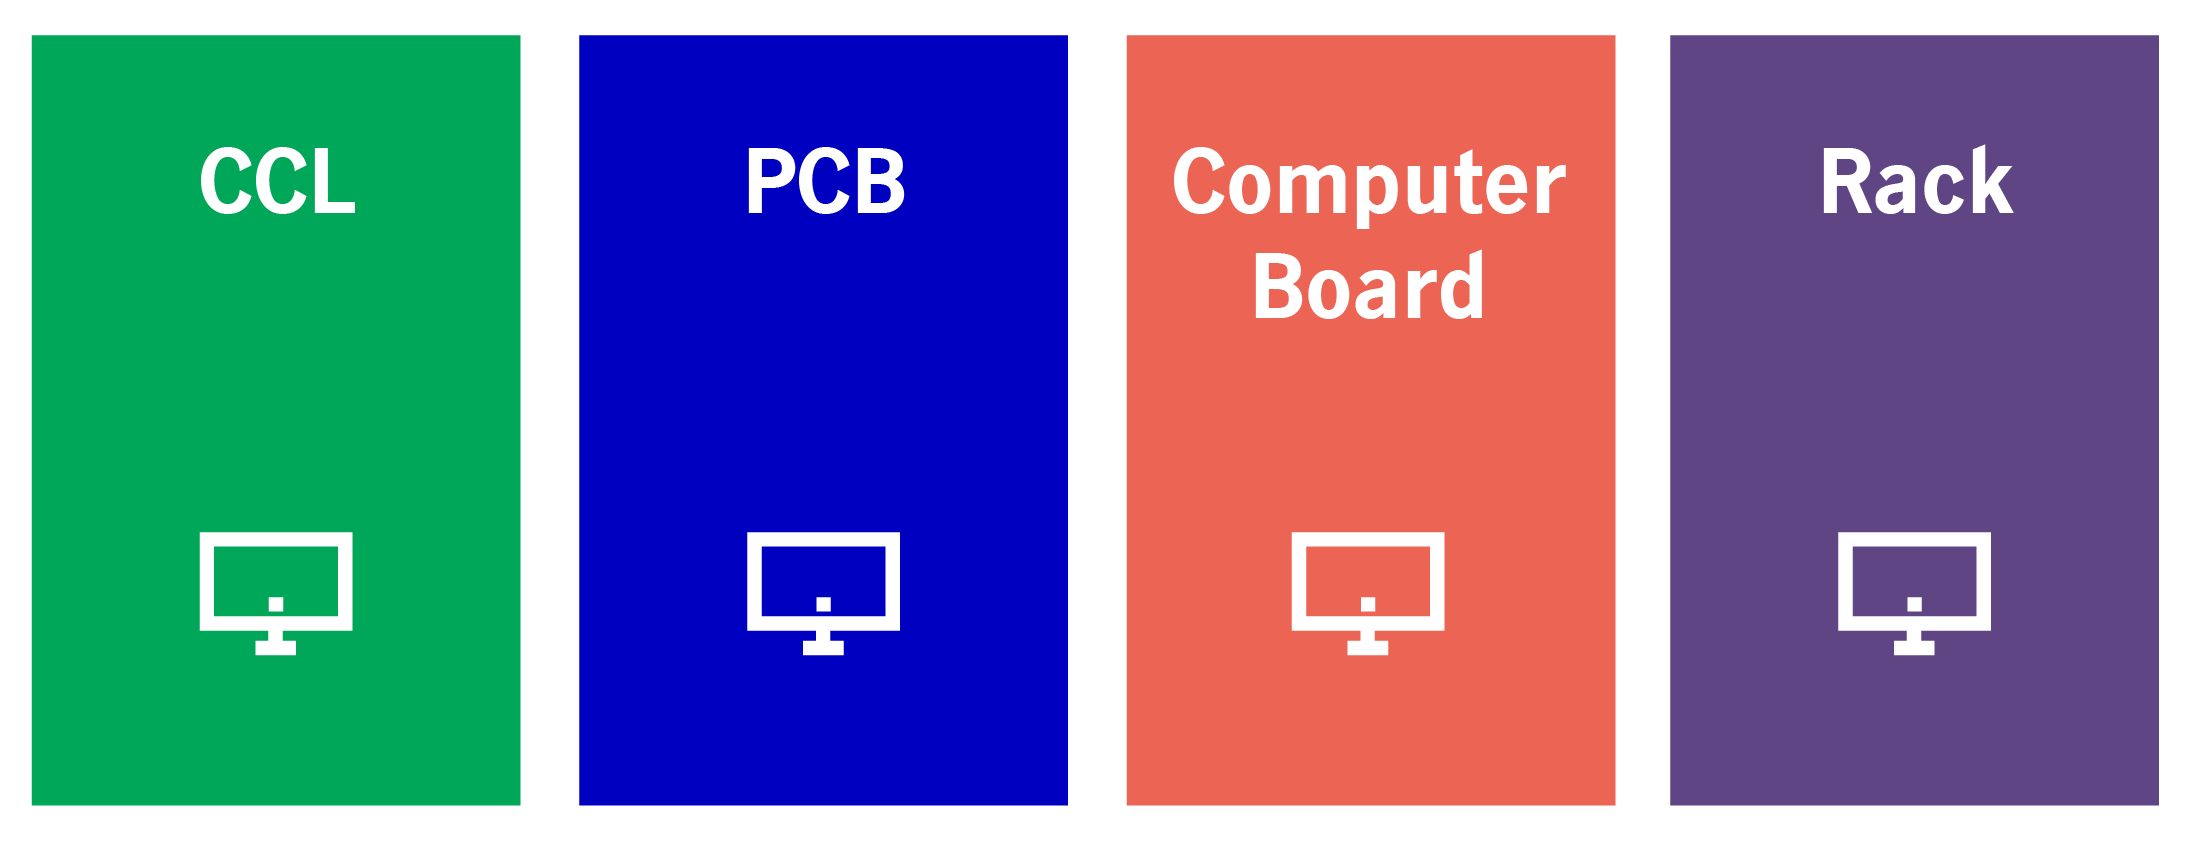
Chart 29: A world-leading US semi company’s major product related offerings + rack system assembly
PC: AI PC adoption may take off
The PC market had two consecutive years of double-digit shipment declines in 2022-23, with demand finally stabilising. The PC market should recover in the next 1-2 years, driven by an enterprise replacement/upgrade cycle and rising AI PC adoption.
Memory: Server Dynamic Random Access Memory (DRAM) to Compression Attached Memory Module (CAMM) 2 to proliferate
The proliferation of high bandwidth memory (HBM) technology is mainly used for applications that require high-performance computing, such as graphics cards, AI and supercomputers. We believe HBM players are the key beneficiaries of the trend.
Conclusion
Although Taiwan Region is an export-oriented economy and may be subject to potential US tariff hikes, Taiwanese companies have been investing in overseas markets (e.g. the US) more aggressively over the last few years and diversifying their export destinations. Hence, any potential negative impact has been reduced.
The major potential risks for the Taiwan Region going into 2025 are (1) a potential slowdown of developed-market economies (as a result of technology demand), (2) uncertainty surrounding tariff policies, etc.
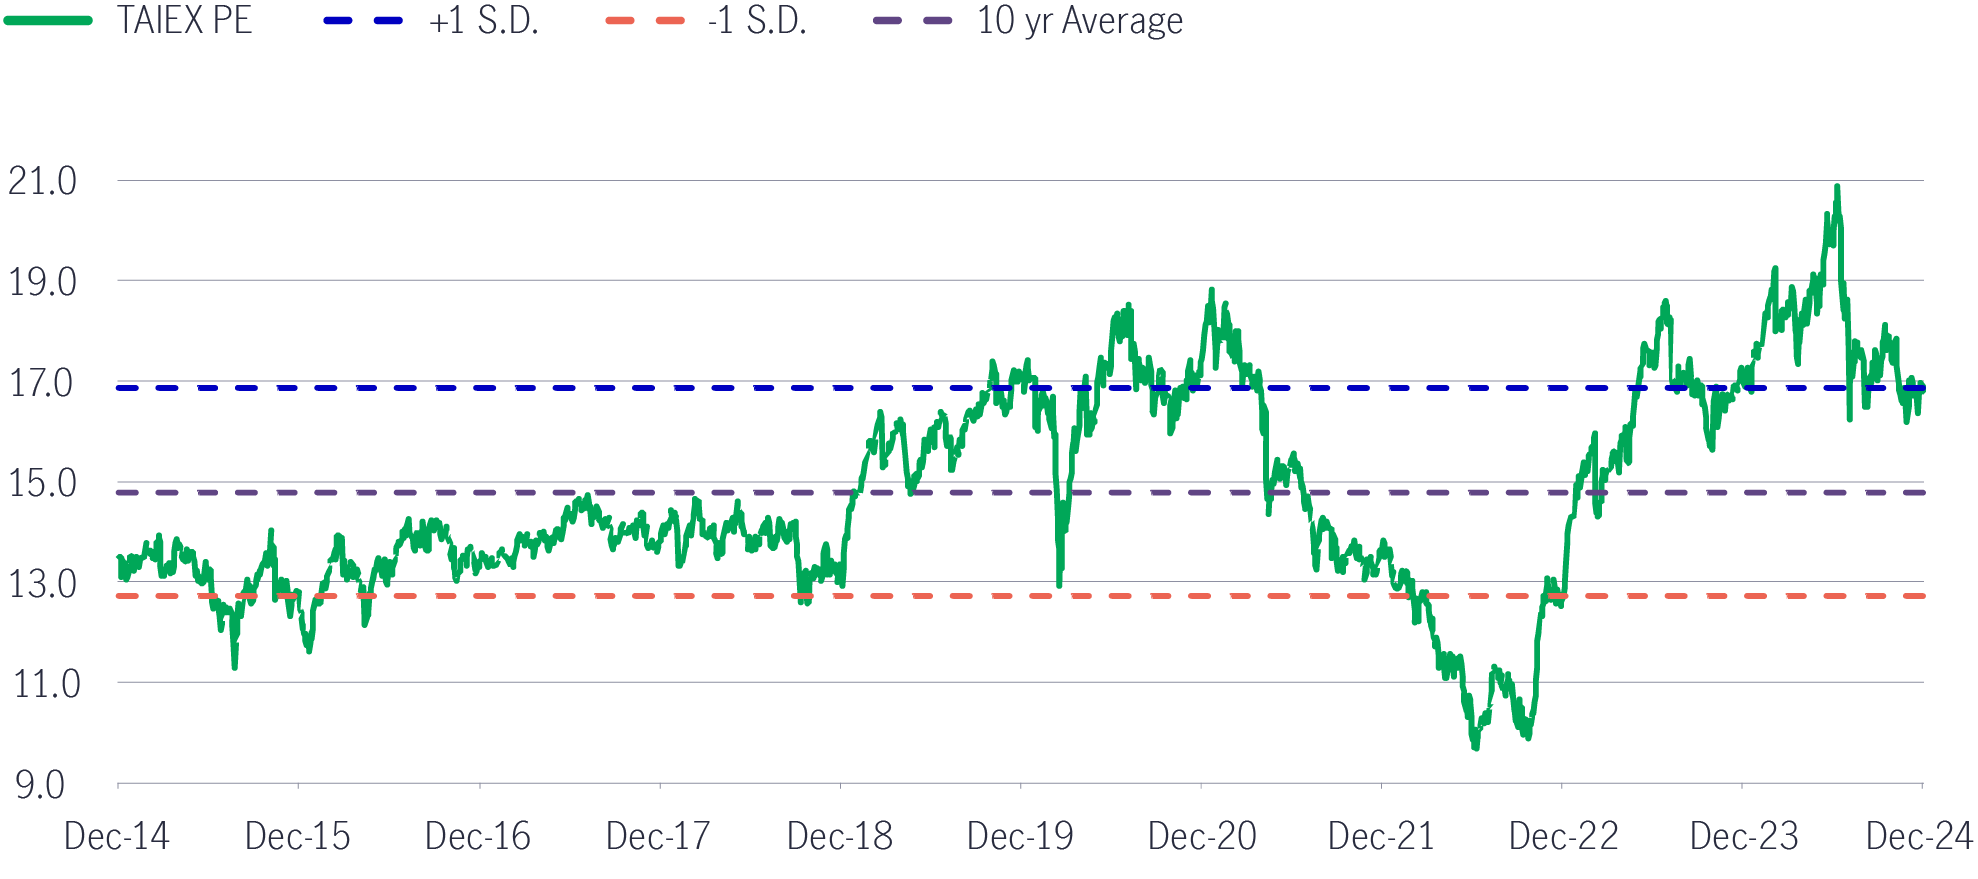
For the medium-to-long term, we believe the next generation of AI development continues to present many structural opportunities across foundries, the next generation of AI, data centres, and HBM, etc.
Chart 30: TAIEX valuation
1 A reading above 50 indicates an expansion in manufacturing activity, while a number below that reflects a contraction. SSE. 2. L0 = no automation, L1/2 = partial automation, L3 = conditional automation, L4 = self-driving, L5 = fully autonomous
Investing involves risks, including the potential loss of principal. Financial markets are volatile and can fluctuate significantly in response to company, industry, political, regulatory, market, or economic developments. These risks are magnified for investments made in emerging markets. Currency risk is the risk that fluctuations in exchange rates may adversely affect the value of a portfolio’s investments.
The information provided does not take into account the suitability, investment objectives, financial situation, or particular needs of any specific person. You should consider the suitability of any type of investment for your circumstances and, if necessary, seek professional advice.
This material is intended for the exclusive use of recipients in jurisdictions who are allowed to receive the material under their applicable law. The opinions expressed are those of the author(s) and are subject to change without notice. Our investment teams may hold different views and make different investment decisions. These opinions may not necessarily reflect the views of Manulife Investment Management or its affiliates. The information and/or analysis contained in this material has been compiled or arrived at from sources believed to be reliable, but Manulife Investment Management does not make any representation as to their accuracy, correctness, usefulness, or completeness and does not accept liability for any loss arising from the use of the information and/or analysis contained. The information in this material may contain projections or other forward-looking statements regarding future events, targets, management discipline, or other expectations, and is only current as of the date indicated. The information in this document, including statements concerning financial market trends, are based on current market conditions, which will fluctuate and may be superseded by subsequent market events or for other reasons. Manulife Investment Management disclaims any responsibility to update such information.
Neither Manulife Investment Management or its affiliates, nor any of their directors, officers or employees shall assume any liability or responsibility for any direct or indirect loss or damage or any other consequence of any person acting or not acting in reliance on the information contained here. All overviews and commentary are intended to be general in nature and for current interest. While helpful, these overviews are no substitute for professional tax, investment or legal advice. Clients should seek professional advice for their particular situation. Neither Manulife, Manulife Investment Management, nor any of their affiliates or representatives is providing tax, investment or legal advice. This material was prepared solely for informational purposes, does not constitute a recommendation, professional advice, an offer or an invitation by or on behalf of Manulife Investment Management to any person to buy or sell any security or adopt any investment strategy, and is no indication of trading intent in any fund or account managed by Manulife Investment Management. No investment strategy or risk management technique can guarantee returns or eliminate risk in any market environment. Diversification or asset allocation does not guarantee a profit or protect against the risk of loss in any market. Unless otherwise specified, all data is sourced from Manulife Investment Management. Past performance does not guarantee future results.
Manulife Investment Management
Manulife Investment Management is the global wealth and asset management segment of Manulife Financial Corporation. We draw on more than a century of financial stewardship to partner with clients across our institutional, retail, and retirement businesses globally. Our specialist approach to money management includes the highly differentiated strategies of our fixed-income, specialized equity, multi-asset solutions, and private markets teams—along with access to specialized, unaffiliated asset managers from around the world through our multimanager model.
This material has not been reviewed by, is not registered with any securities or other regulatory authority, and may, where appropriate, be distributed by the following Manulife entities in their respective jurisdictions. Additional information about Manulife Investment Management may be found at manulifeim.com/institutional
Australia: : Manulife Investment Management Timberland and Agriculture (Australasia) Pty Ltd, Manulife Investment Management (Hong Kong) Limited. Canada: Manulife Investment Management Limited, Manulife Investment Management Distributors Inc., Manulife Investment Management (North America) Limited, Manulife Investment Management Private Markets (Canada) Corp. Mainland China: Manulife Overseas Investment Fund Management (Shanghai) Limited Company. European Economic Area: Manulife Investment Management (Ireland) Ltd. which is authorised and regulated by the Central Bank of Ireland Hong Kong: Manulife Investment Management (Hong Kong) Limited. Indonesia: PT Manulife Aset Manajemen Indonesia. Japan: Manulife Investment Management (Japan) Limited. Malaysia: Manulife Investment Management (M) Berhad 200801033087 (834424-U) Philippines: Manulife Investment Management and Trust Corporation. Singapore: Manulife Investment Management (Singapore) Pte. Ltd. (Company Registration No. 200709952G) South Korea: Manulife Investment Management (Hong Kong) Limited. Switzerland: Manulife IM (Switzerland) LLC. Taiwan: Manulife Investment Management (Taiwan) Co. Ltd. United Kingdom: Manulife Investment Management (Europe) Ltd. which
is authorised and regulated by the Financial Conduct Authority
United States: John Hancock Investment Management LLC, Manulife Investment Management (US) LLC, Manulife Investment Management Private Markets (US) LLC and Manulife Investment Management Timberland and Agriculture Inc. Vietnam: Manulife Investment Fund Management (Vietnam) Company Limited.
Manulife, Manulife Investment Management, Stylized M Design, and Manulife Investment Management & Stylized M Design are trademarks of The Manufacturers Life Insurance Company and are used by it, and by its affiliates under license.
4116163


