Fed easing cycle supports US fixed income assets
The long-awaited pivotal shift in the US Federal Reserve's (Fed’s) monetary policy finally arrived in September, marking the first rate cut since 2020. While there might be uncertainties in the US macro-outlook and the interest rate cut path, the start of the US easing cycle could be a tailwind for US fixed income asset classes, particularly preferred securities due to their higher-quality (on average investment-grade rated), lower default rates and higher-yielding nature. We believe that the dynamic investment approaches of the Preferred Securities and the USD Income (USD core fixed income) help navigate economic and rate cycles, offering attractive investment opportunities for fixed-income investors seeking higher-quality assets with relatively stable income.

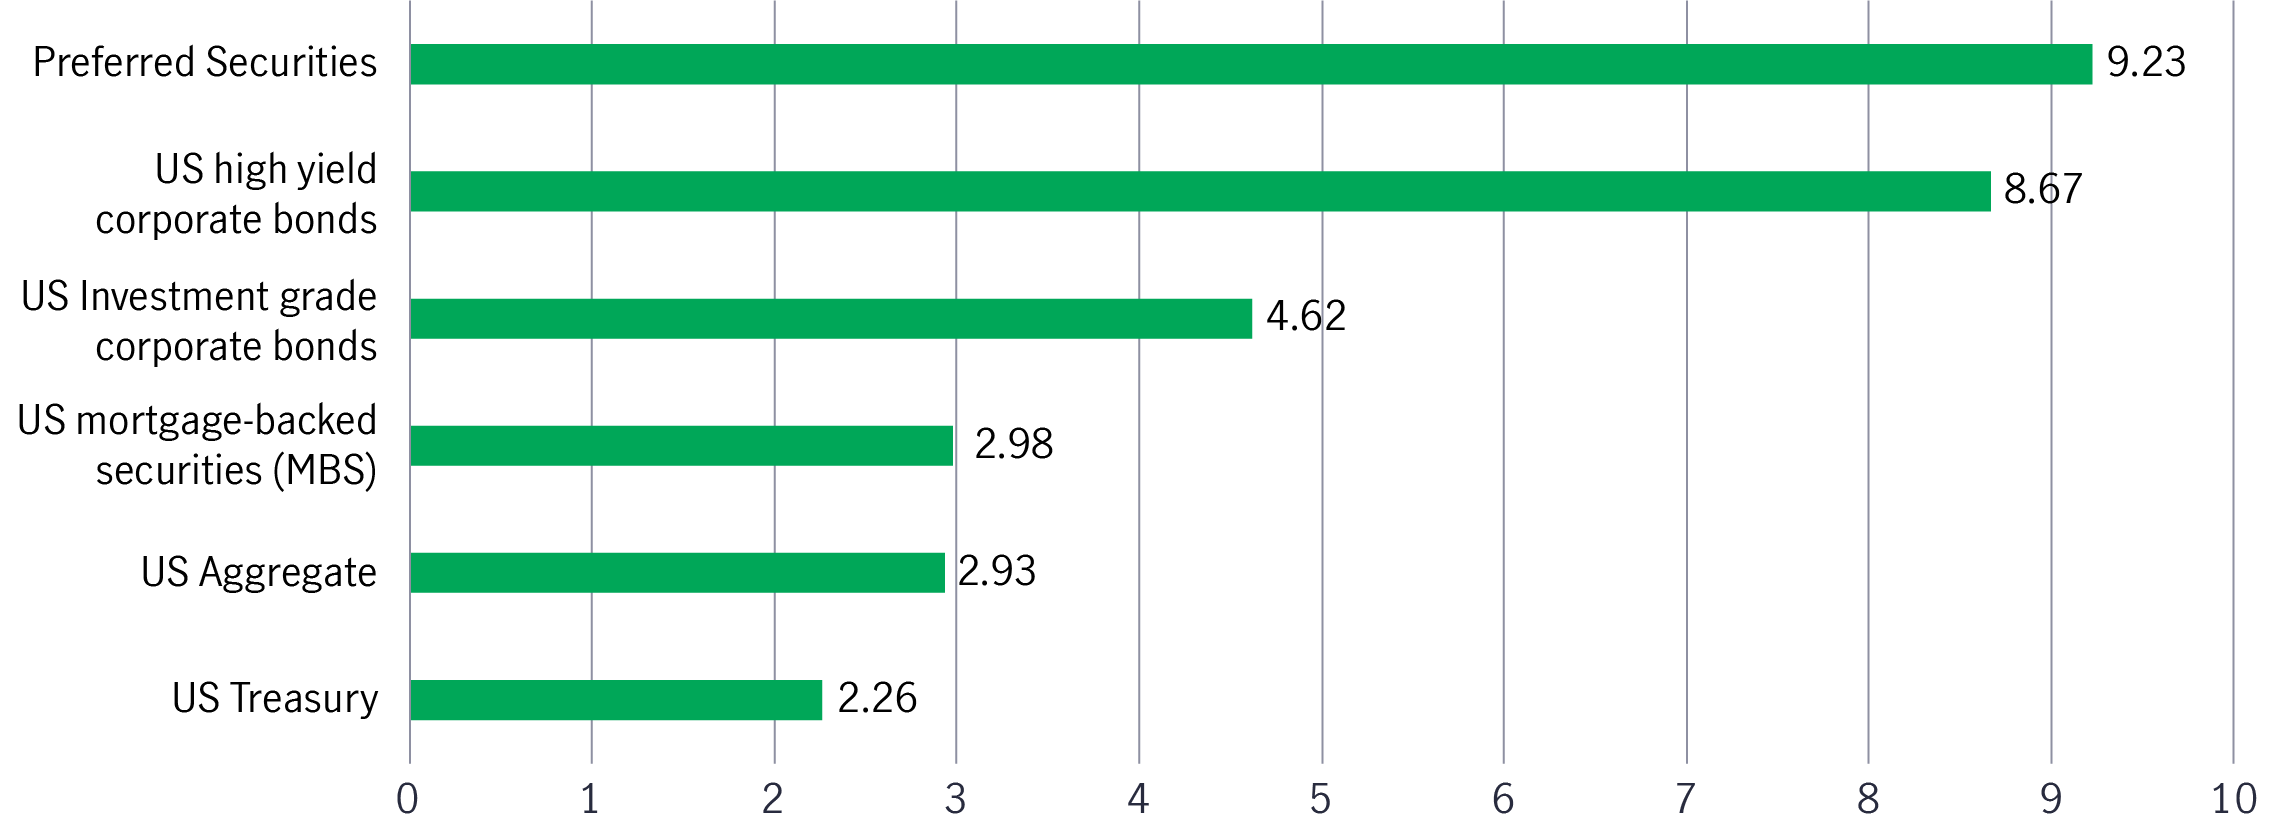
The US fixed income market generally posted strong returns in the third quarter, as the Fed started the easing cycle with a 50 basis points cut of Federal fund rate in September1. On a year-to-date basis, major US fixed income assets recorded positive returns, with preferred securities continuing to outperform among them (see chart 1)2. Preferred securities have benefitted from a net supply contraction providing technical support, and market assumptions of lighter bank regulations following the US election.
Chart 1: US fixed income market year-to-date cumulative performance (%) (As of 30 November 2024)2
Preferred Securities
Given the ongoing easing cycle, the market is currently assessing the extent and pace of the Fed’s rate cuts. Preferred securities have historically, except during the Global Financial Crisis, thrived in a falling rate environment due to their higher-quality (investment-grade) and higher-yielding nature (see chart 2)3.
Chart 2: Average market returns following the start of past 4 rate cut cycles* (%)3
*excluding the 2007 rate cut cycle following the global financial crisis (GFC)

Declining rates historically supportive of preferred performance
Following the start of past four rate-cut cycles, preferred securities delivered higher returns than other US fixed-income assets (including high quality investment grade bonds, and high yield bonds) over 3-month, 6-month and 12-month periods4.
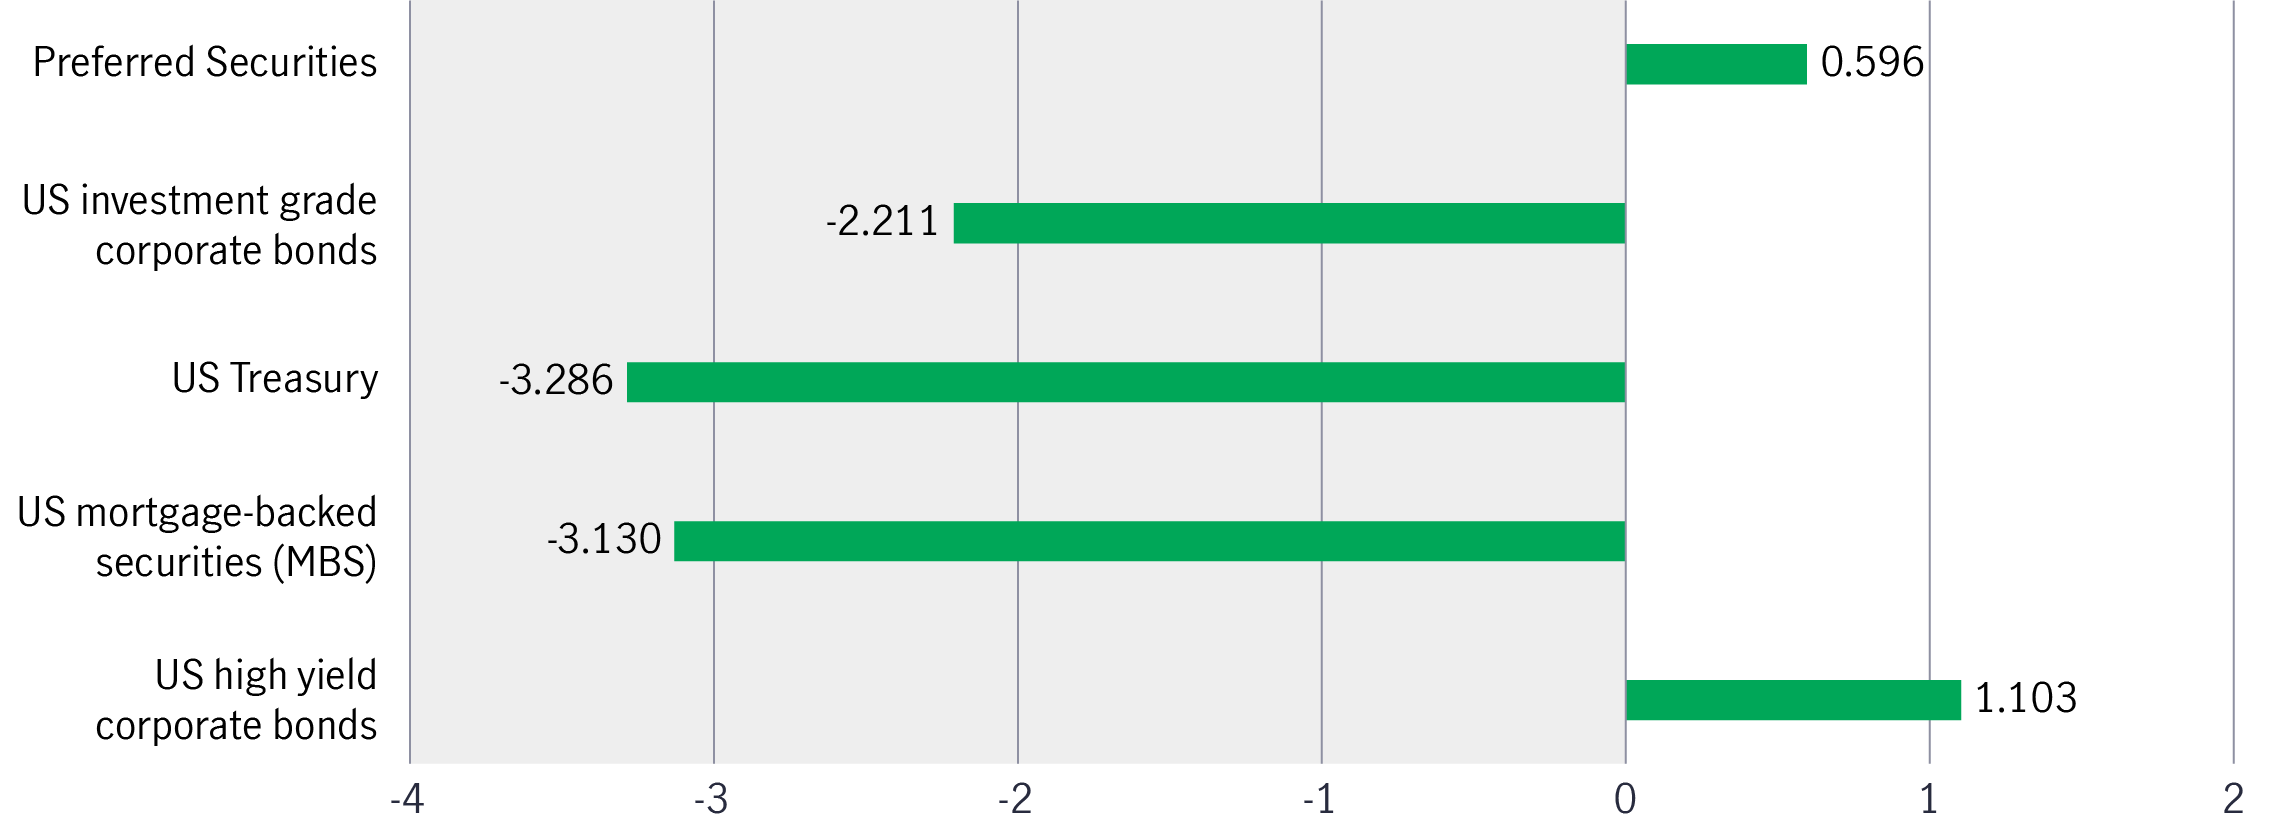
After the first rate cut in September, we noticed that preferred securities continued to outperform US investment grade bonds, US treasury and US mortgage-backed securities (MBS) over the three-month period (see chart 3)4.
Chart 3: 3-month returns since Fed rate cut in September 2024 (%) 4
We believe preferred securities are appealing, too, in terms of valuation. As credit spreads are currently narrow across most fixed income instruments, it is crucial to emphasise the importance of selecting appropriate securities within a capital structure to generate significant income and safeguard capital.
We believe this can be accomplished by holding preferred securities, typically having a lower capital structure, and offering greater spread. As of 30 November 2024, the credit spread of preferred securities narrowed to 156 basis points, below its 10-year average but above the 10-year lows. Meanwhile, US high yield corporate bonds and US investment grade corporate bonds were trading near the tightest yield spread over the past decade, implying less room for further tightening (capital gain) as compared to preferred securities5.
First electricity demand growth in many years to support utility preferreds outlook
The flexibility of the preferred security universe allows for allocation across various fixed income sectors and credit levels, making it easier to navigate softer economic environments. Regarding sector allocation, we have a high conviction of overweighting the US electric utility sector. We have been covering the sector for over 30 years but the fundamentals have never been as strong as now. In particular, the sector is supported by three tailwinds:
1. AI-driven demand:
For decades, there was very little demand growth in the electricity utility market, given the use of much more energy-efficient appliances. The recent advent of artificial intelligence (AI) demand and data centres needed to create AI derive colossal power consumption. Consequently, US power demand is expected to increase by 38% over the next two decades. This strong demand drives renewable energy growth, as it is low-cost (the cheapest form of electricity generation), fast to deploy, and provides clean energy.
In addition, generators must be built to feed new data centres, on which utility companies need to spend USD 50 billion over the next decade6. Since the sector gets a regulated rate of return on its investments, these investments generate very visible earnings and cash flow growth over the period.
2. Lower rate beneficiaries:
Some convertible preferred securities are issued by utility companies, and utility equities benefit from lower rates because they are considered bond proxies. They typically underperform in a rising rate environment but post strong returns in a rate-cut environment.
3. Defensive hedge:
Because of the nature of the business, utility preferred securities are considered as a defensive hedge. They have outperformed the overall preferred securities market over the last three and five years and can provide downside protection in times of elevated volatility. The utility sector in the US is regulated, which means that utility companies’ earnings and cash flows do not fluctuate much with the general economic environment. We saw this happen in 2020 when, during COVID, most sectors in the US equity market dramatically reduced their earnings expectations.
Apart from strong fundamentals, we favour utility preferred securities for their lower valuation compared to the S&P 500, investment-grade rated balance sheets, and attractive yields.
We also find better opportunities in the US banking preferred securities as they are strong, well-capitalised, and have ample liquidity. US banks have reported solid earnings results, significantly benefiting from rising net interest margin (NIM) and loan growth. We favour large, diversified banks as they are expected to benefit from deposit inflows.
USD Income (USD core fixed income)
Given the complexity of the macro environment today, we believe an unconstrained, dynamic asset allocation approach would enhance yield while benefitting from its flexibility to navigate the entire opportunity set of credit and rates through various economic and rate cycles.
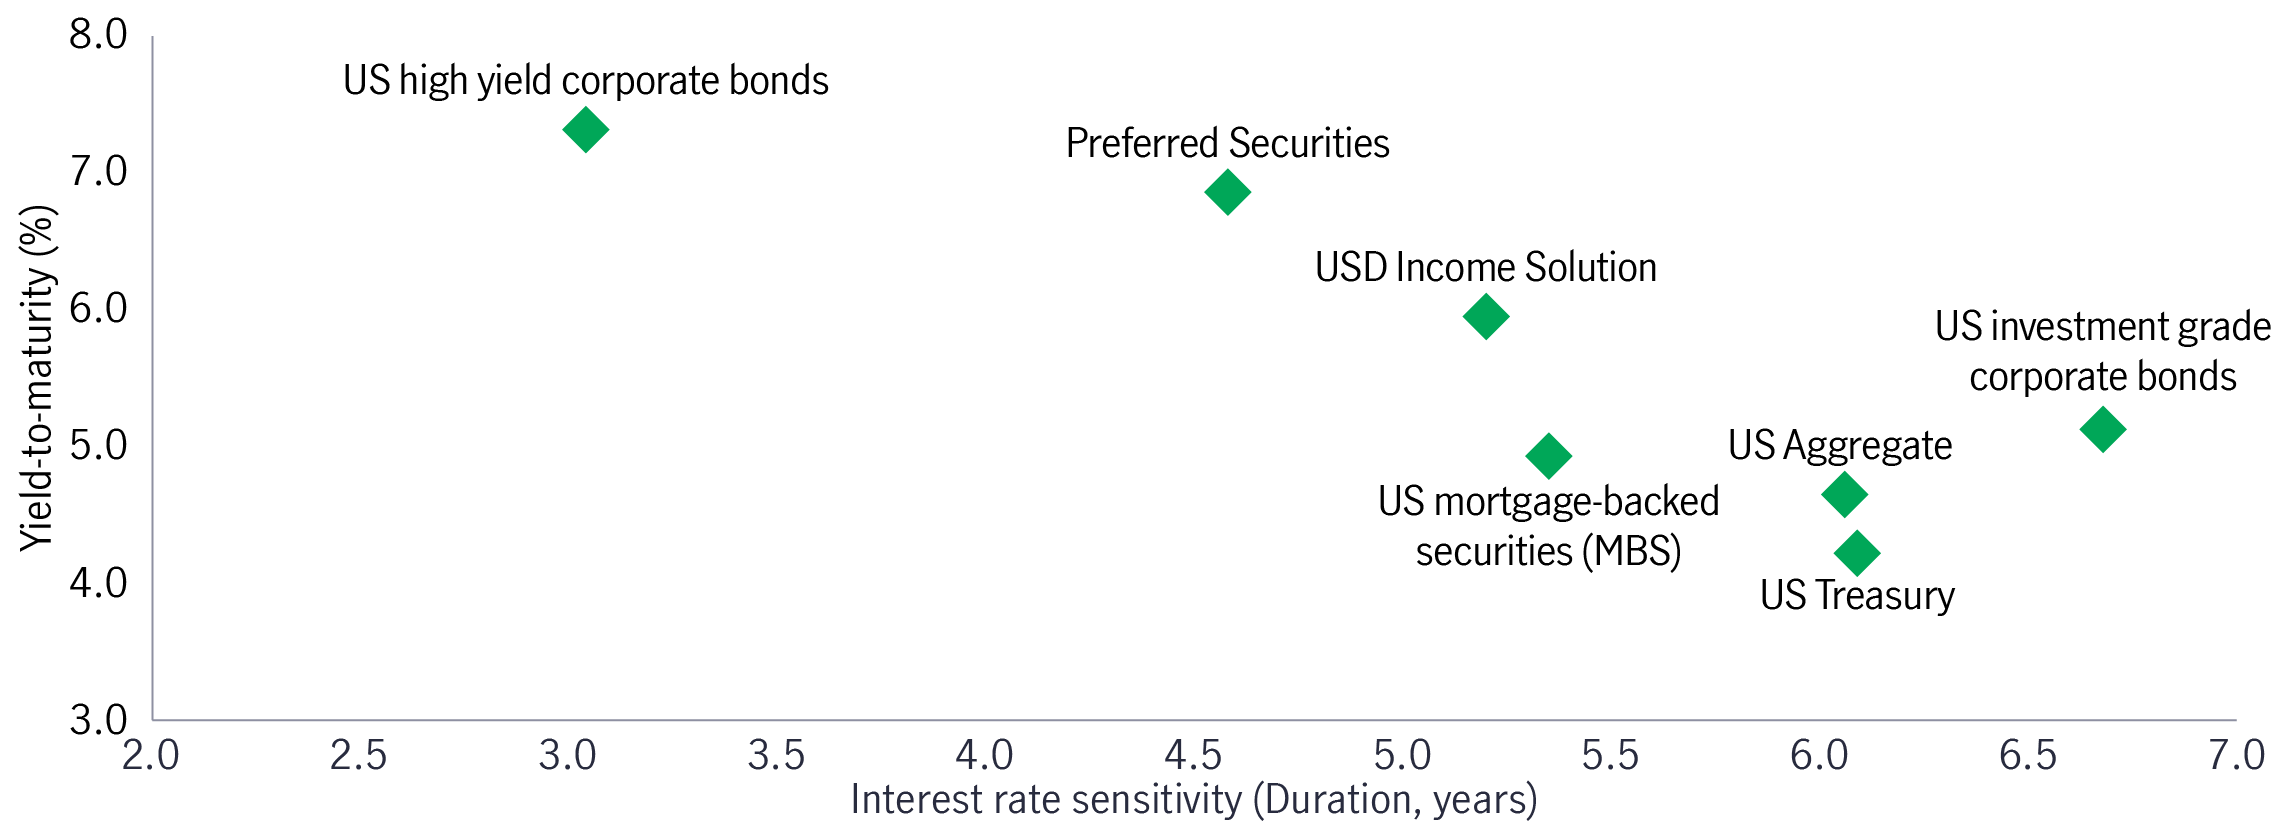
The USD Income combines opportunistic credits (Preferred securities, investment-grade bonds, high-yield bonds), securitised assets [(Agency mortgage-backed securities (Agency MBS), Commercial mortgage-backed securities (CMBS) and Asset-backed securities (ABS)] and US Treasuries allocations. Compared to a single US fixed income asset class, this diversified solution aims to get a relatively high yield (5.95%) while keeping the interest sensitivity (duration 5.2 years, 0.85 years shorter than Bloomberg US Aggregate bond index) under control, balancing interest rate and credit risk (see chart 4)7.
Chart 4: Yield and interest rate sensitivity comparison in US fixed income space7
Using a fundamental bottom-up approach to fixed income investing, we use relative valuation to find the most attractive opportunities within the three sleeves.
Opportunistic credit: Focus on preferred securities
Opportunistic credit allocation is the major source of income for the solution, with higher-quality preferred securities being the largest contributor and yield enhancer.
Since the USD Income aims to achieve relatively stable income and volatility, we are constructive on institutional par preferreds, as they are at the top of the capital structure and possess attractive relative yields and valuations. We also favour junior subordinated preferreds.
Additionally, the flexibility of the preferred security universe allows for allocation across various fixed-income sectors and credit levels, making it easier to navigate softer economic environments. We prefer defensive sectors like electric utilities, as they have historically shown resilience during times of stress and have provided solid downside protection. Within financials, another area we are overweight, we focus on the largest banks, which are in excellent shape as historical percentages of non-performing loans are near all-time lows.
Securitised credit: Constructive on Agency MBS
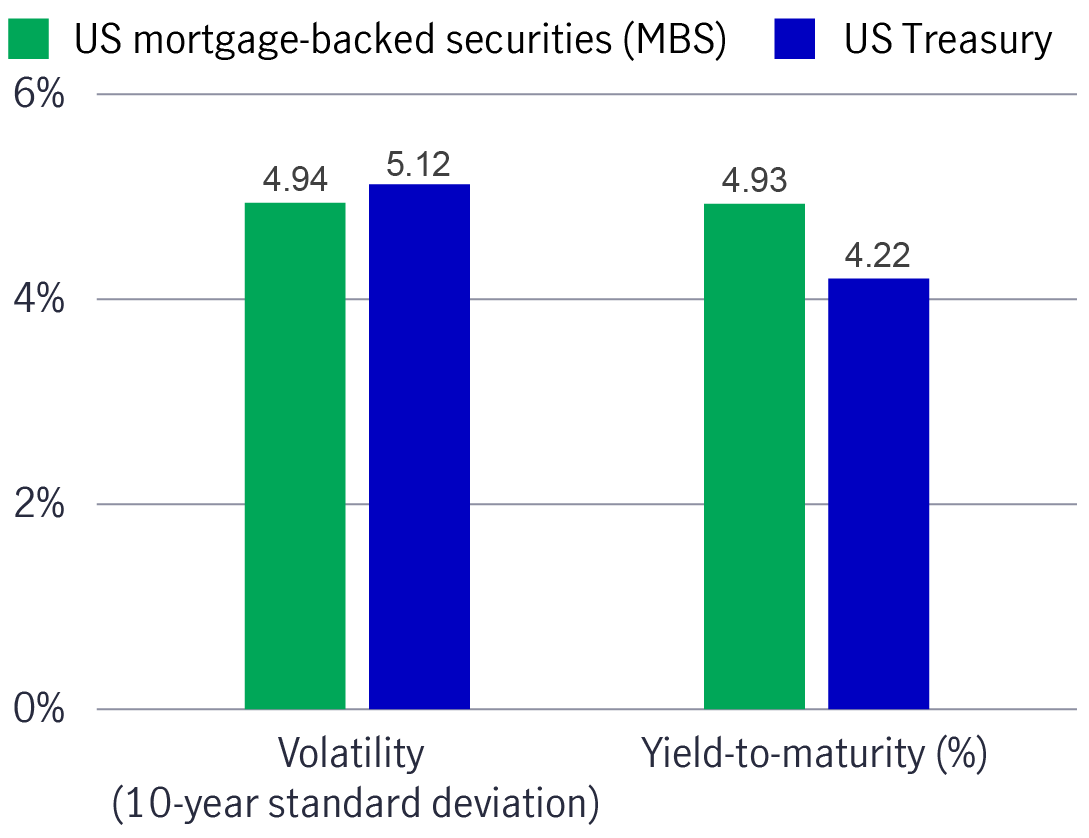
We believe securitised credit, agency MBS in particular, offers a quality yield premium over the US Treasuries with similar volatility (see chart 5)8. In addition, agency MBS spreads remain well above their long-term averages.
Chart 5: Agency MBS offer higher yield with similar volatility versus US treasury8
Another vital aspect of adding securitised credit is that it serves as an excellent liquidity source, providing an easy way to cash out and move into the other two sleeves.
While we expect the US will likely experience a soft landing, in the unlikely scenario that the US enters a full-blown recession or market sentiment shifts to risk-off, the solution could liquidate the securitised holdings and shift to overweight treasuries.
US Treasuries: Duration-neutral approach, focus intermediate bonds
While the Fed moves monetary policy to a more neutral setting over time, path to getting there is not preset. Recent comments by the Fed hinted that there is no need to be in a hurry to lower rates given the strong economy9.
Regardless of the US interest rate trajectory, we expect the yield curve to steepen. In a scenario where the Fed cuts rates aggressively, we will see short-term treasury yields decline and long-term treasury yield remain fairly stable, resulting in a steepening yield curve. Whereas if the Fed does not cut rates as aggressively because of stickier inflation, long-term rates are expected to increase, which will again result in a steeper yield curve.
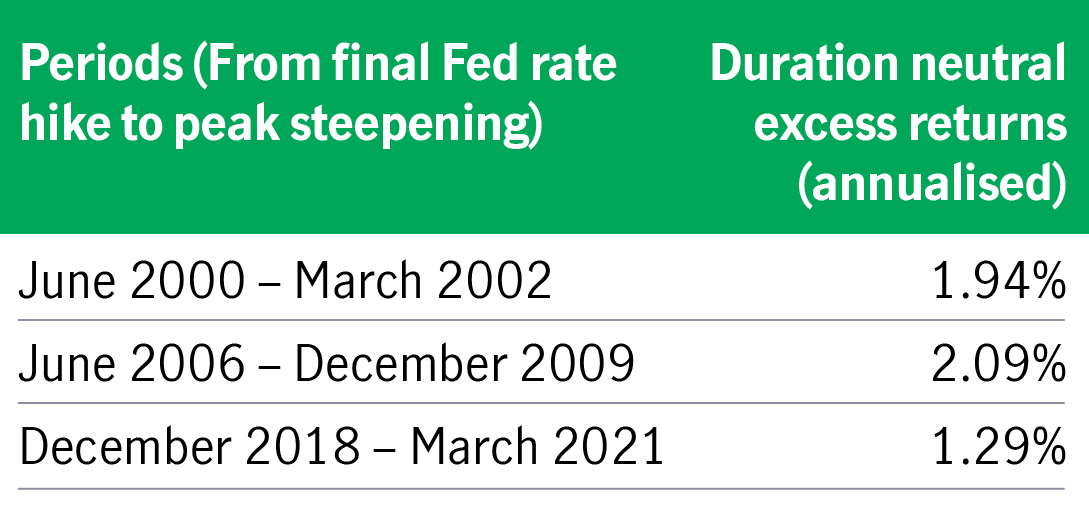
Therefore, we always maintain a duration neutral approach which is essential to deliver stable income and consistent performance. We will continue to focus on intermediate bonds where we have been able to generate the most alpha. Intermediate bonds historically outperformed the traditional barbell approach (short and longer maturity bonds) by one to two percentage points (annualised) over the last three steepening cycles (see chart 6)10.
Chart 6: Intermediate bonds typically outperform short and longer maturity bonds when yield curve steepens10
Conclusion
US rate cuts can be a tailwind for US fixed income. There are appealing opportunities to generate income within credit and spread sectors, with the potential for spread compression and limited risk of permanent capital impairment.
Based on their investment objectives, volatility tolerance, and income expectations, investors may choose the most suitable income solution from the two US fixed-income solutions mentioned.
The Preferred Securities offers higher yields but from high-quality companies where default risk is small. The USD Income is considered to be more of a core fixed income solution and is more diversified, compared to the Preferred Securities, but offers a lower yield.
1 Federal Reserve had its first rate cut by 50 basis points on 18 September 2024 (US time). 2 Source: Bloomberg, as of 30 November 2024. Preferred securities represented by ICE BofA US Capital Securities Index (C0CS); US High Yield bonds, US Investment grade corporate bonds, and US Treasuries represented by ICE BofA indices. US mortgage-backed securities (MBS) are represented by ICE BofA US MBS Index. Bloomberg bond index represent US Aggregate. For illustrative purposes only. Past performance is not indicative of future performance. 3 Source: Bloomberg, as of 30 November 2024. Credit ratings refer to Bloomberg composite rating. The average credit rating of preferred securities is BBB- and yields 6.88%; other higher-yielding US fixed income assets like US high yield corporate bonds and US BB high yield corporate bonds, their average credit ratings are B+ and BB (non-investment-grade) respectively, while their yields are 7.36% and 6.25% respectively. Preferred Securities are represented by ICE BofA US Capital Securities Index. US high yield corporate bonds are represented by ICE BofA US High Yield Index; US BB high yield corporate bonds are represented by ICE BofA BB US High Yield Index. The above yield does not represent the distribution yield of any fund and is not an accurate reflection the actual return that an investor will receive in all cases. A positive distribution yield does not imply a positive return. For illustrative purposes only. Past performance is not indicative of future performance. 4 Source: Bloomberg, as of 17 December 2024. Past four rate cut cycles refer to July 1995 - January 1996, September 1998 – November 1998, March 2001 – June 2003 and July 2019 – March 2020. Monthly data are used for average return calculation. 3-month return period since Fed rate cut in September refers to 18 September 2024 – 17 December 2024. Total return. Preferred securities are represented ICE BofA Fixed Interest Preferred Securities Index (P0P1) for the rate cut cycle of 1995 – 1996 and represented by 50% ICE BofA Fixed Interest Preferred Securities Index (P0P1) and 50% ICE BofA US Capital Securities Index (C0CS) for the rate cut cycle of 1998 – 1999, 2001 – 2003 and 2019 – 2020. US investment grade corporate bonds are represented by ICE BofA US Corporate index; US Treasury is represented by ICE BofA US Treasury & Agency index ; US mortgage-backed securities (MBS) are represented by ICE BofA US Mortgage Backed Securities Index; US high yield corporate bonds are represented by ICE BofA US High Yield index;. For illustrative purposes only. Past performance is not an indication of future results. 5 Source: Bloomberg, as of 30 November 2024. Preferred Securities are represented by ICE BofA US All Capital Securities Index. US high yield corporate bonds are represented by ICE BofA US High Yield Index. US investment grade bonds are represented by ICE BofA US Corporate Index. Past performance is not indicative of future performance. 6 NextEra Energy Investor Conference 2024, 11 June 2024. 7 Source: Bloomberg, Morningstar, as of 30 November 2024. Preferred Securities represented by ICE BofA US Capital Securities Index; US Aggregate, US high yield corporate bonds, US investment grade corporate bonds, and US Treasury represented by Bloomberg Bond Indices. US mortgage-backed securities (MBS) are represented by ICE BofA US MBS Index. Past performance is not indicative of future performance. 8 Source: Bloomberg, as of 30 November 2024. Agency MBS and US Treasuries represented by Bloomberg indices. The above yield refers to yield-to-maturity and does not represent the distribution yield of any Fund and is not an accurate reflection the actual return that an investor will receive in all cases. Volatility represented by 10-year annualised standard deviation based on monthly data. For illustrative purposes only. Past Performance is not indicative of future performance. 9 Federal Reserve, 14 November 2024. Chairman Powell commented “The economy is not sending any signals that we need to be in a hurry to lower rates. The strength we are currently seeing in the economy gives us the ability to approach our decisions carefully. Ultimately, the path of the policy rate will depend on how the incoming data and the economic outlook evolve.” 10 Bloomberg, as of 30 September, 2024. Returns greater than one year are annualized. Duration-Neutral barbell approach weighs the blended Bloomberg 1-3 Year Treasury Index and Bloomberg 25+ Year Treasury Index to match the duration of the duration-neutral Bloomberg 5-7 Year Treasury Index. Past Performance is not indicative of future performance.
Investing involves risks, including the potential loss of principal. Financial markets are volatile and can fluctuate significantly in response to company, industry, political, regulatory, market, or economic developments. The information provided does not take into account the suitability, investment objectives, financial situation, or particular needs of any specific person.
All overviews and commentary are intended to be general in nature and for current interest. While helpful, these overviews are no substitute for professional tax, investment or legal advice. Clients and prospects should seek professional advice for their particular situation. Neither Manulife Investment Management, nor any of its affiliates or representatives (collectively “Manulife Investment Management”) is providing tax, investment or legal advice.
This material is intended for the exclusive use of recipients in jurisdictions who are allowed to receive the material under their applicable law. The opinions expressed are those of the author(s) and are subject to change without notice. Our investment teams may hold different views and make different investment decisions. These opinions may not necessarily reflect the views of Manulife Investment Management. The information and/or analysis contained in this material has been compiled or arrived at from sources believed to be reliable, but Manulife Investment Management does not make any representation as to their accuracy, correctness, usefulness, or completeness and does not accept liability for any loss arising from the use of the information and/or analysis contained. The information in this material may contain projections or other forward-looking statements regarding future events, targets, management discipline, or other expectations, and is only current as of the date indicated. The information in this document, including statements concerning financial market trends, are based on current market conditions, which will fluctuate and may be superseded by subsequent market events or for other reasons. Manulife Investment Management disclaims any responsibility to update such information.
Manulife Investment Management shall not assume any liability or responsibility for any direct or indirect loss or damage or any other consequence of any person acting or not acting in reliance on the information contained here. This material was prepared solely for informational purposes, does not constitute a recommendation, professional advice, an offer or an invitation by or on behalf of Manulife Investment Management to any person to buy or sell any security or adopt any investment approach, and is no indication of trading intent in any fund or account managed by Manulife Investment Management. No investment strategy or risk management technique can guarantee returns or eliminate risk in any market environment. Diversification or asset allocation doesn’t guarantee a profit or protect against the risk of loss in any market. Unless otherwise specified, all data is sourced from Manulife Investment Management. Past performance does not guarantee future results.
This material has not been reviewed by, and is not registered with, any securities or other regulatory authority, and may, where appropriate, be distributed by Manulife Investment Management and its subsidiaries and affiliates, which includes the John Hancock Investment Management brand. © 2024 by Manulife Investment Management. Manulife Securities and/or Manulife Private Wealth are using with permission. The statements and opinions expressed in this article are those of the author. Manulife Private Wealth cannot guarantee the accuracy or completeness of any statements or data.
Manulife, Manulife Investment Management, Stylized M Design, and Manulife Investment Management & Stylized M Design are trademarks of The Manufacturers Life Insurance Company and are used by it, and by its affiliates under license.
4113393

