China-U.S. trade tensions—separating the forest from the trees
China-U.S. tensions escalated in August when Washington placed additional tariffs on Chinese goods.¹ The Chinese government responded in kind.² Although the two countries have agreed to restart trade talks since then,³ decelerating global growth and global challenges are capturing the attention of Asian central banks and governments.

Our view: China-U.S. trade tensions will likely remain a long-term fixture of the investment landscape. However, investors should look beyond the daily headlines to the innovative and supportive measures being adopted regionally.
China-U.S. trade tensions have continued to escalate with the latest round of tariffs; however, we believe that a change in bilateral dynamics has occurred. The Chinese government is now, arguably, deciding which direction future trade negotiations should take. This is a marked change from when the trade spat first emerged in 2018, when the United States controlled negotiations with a list of grievances, a stronger economy and robust financial markets. This marked change has occurred due to U.S. economic weakness, the rapidly approaching 2020 U.S. election cycle, and no additional room for tariffs. China now has more options to decide if it wants to engage with the United States before the upcoming polls and on what terms.
Despite this change, prolonged trade tensions have inevitably taken their toll on China’s economy and markets. The country’s growth is slowing, with July’s indicators showing a notable deceleration in both investment and consumption. This is on top of Purchasing Managers’ Index data that still indicates economic contraction.⁴
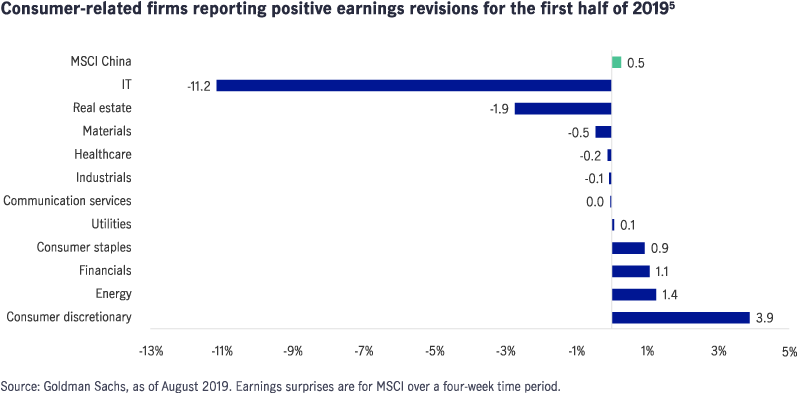
Amid these economic challenges and market volatility, we do see potential bright spots for investors. First-half earnings for important sectors in the Chinese economy were resilient. In particular, consumer discretionary and staples companies posted largely in-line earnings, with a greater proportion of earnings surprises (when a company beats earnings expectations) compared to other sectors.

China’s response: “structural” stimulus to improve competitiveness and promote self sufficiency
The response from both the Chinese government and local firms is more relevant to investors than continued trade tensions, which have largely been priced into markets. Indeed, the Chinese government’s reaction to this economic slowdown has been notably different from that of the 2008-2009 Global Financial Crisis, when large-scale fiscal stimulus focused on a rapid expansion of credit, particularly for infrastructure-related projects.
Instead, the government has focused on structural impetus to improve economic efficiency, develop strategic industries, and decrease the administrative cost burden on companies, particularly small-to-medium sized enterprises. These measures have included:
- Reduced value-added tax (VAT) on companies and lower social security contributions for employees;⁶
- Decreased individual marginal tax rates to stimulate consumption;⁷
- Consumption incentives for autos and electronics.⁸
In August, the People’s Bank of China (PBoC) took another notable step when it reformed the interest-rate mechanism. The PBoC introduced a new interest rate, the loan prime rate (LPR) benchmark, which should essentially lower the effective lending rates for firms.⁹ The PBoC also announced that it would lower the required reserve ratio (RRR) by 50 basis points starting in mid-September.
In addition, we have also been closely watching how China reacts to the increased bifurcation of technology supply chains. Although the U.S. administration has recently extended waivers for certain Chinese technology firms to purchase from U.S. suppliers, supplier divergence is likely to continue over the long term, regardless of when a trade deal is struck.
The Chinese government is hastening the issuance of 5G licenses to develop the technology and promote domestic investment on an accelerated timeframe.¹⁰ At the company level, firms in the electronics and superconductor industries are fast tracking the development of proprietary operating systems and chip design.
Asia’s response: Regional governments turn to fiscal and monetary tools
As global economic growth moderates, central banks and governments across the world are focusing on the increasing risks of a potential recession.
Asia is no different. Over the past month or so, several central banks have unexpectedly slashed interest rates and governments have introduced fiscal stimulus packages to boost domestic demand.
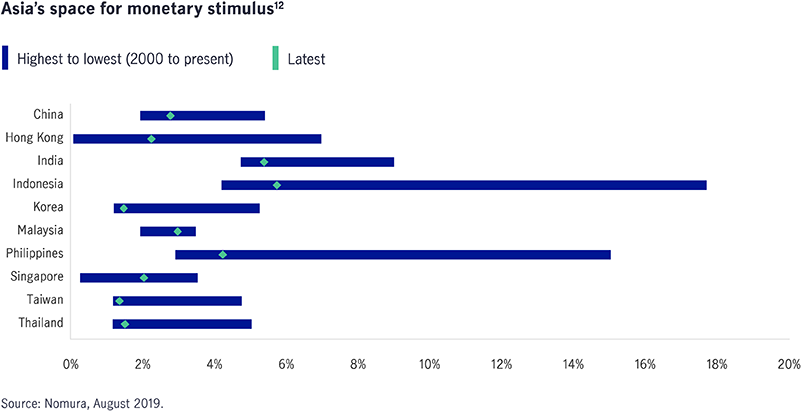
However, we believe Asia is better positioned for growth moderation compared to other regions. One major difference between Asia and other parts of the world is the potential for monetary policy to play an arguably bigger role, as regional markets generally have had a broader band of interest rates. But as economist John Maynard Keynes observed: depending on monetary policy alone is like “pushing on a string”¹¹—it must be complemented with fiscal policy.

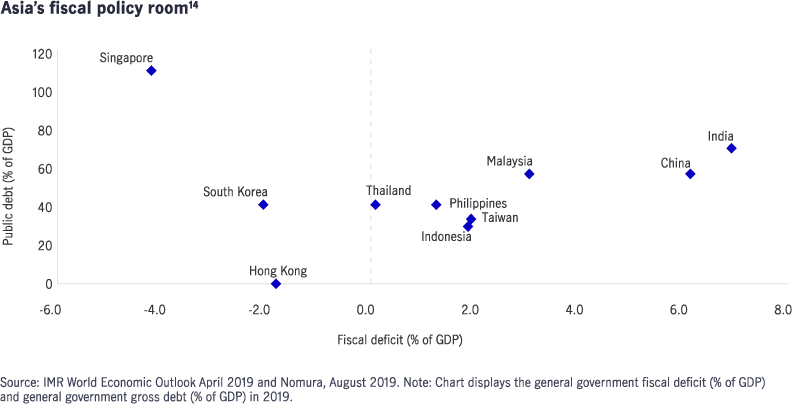
Additionally, Asia also has room for fiscal policy, and we are seeing substantial and more innovative stimulus packages that should have a significant impact on economic growth. The recent decision by President Jokowi of Indonesia to propose the country’s capital move to Borneo, over a five-year period and at a cost of US $33 billion, is one such example.¹³ This is not a typical support package, but one that should lead to a significant economic redistribution across the country, while also promoting growth.

Investment implications: constructive on Southeast Asia, resilient companies
Based on this analysis, we are more constructive on Southeast Asia than Northeast Asia, especially as the risk premium reversed from the south to the north. The monetary and fiscal policies in the ASEAN bloc are taking shape, the election cycle is now over and oil prices have stabilized, while the prospect of a weakening U.S. dollar can present opportunities. In particular, we are positive about the economic prospects in Indonesia, while gradually becoming more neutral to India given the recent reversal on capital gains taxes on foreign investors that was proposed in the Union budget.¹⁵ In contrast, we are moderately constructive on China and Taiwan, less positive about Hong Kong and South Korea, which face greater headwinds from both a macroeconomic and sector perspective. Our preferred sectors in general remain consumer, IT, healthcare and utility.
At the company level, we believe that three types of business are poised to excel in this challenging economic environment. We look at:
- service firms, as opposed to firms that own assets due to volatile currencies;
- “self-help” companies with a strong brand that are able to maintain their topline while cutting costs;
- exporters to non-U.S. destinations, or importers that have alternative sources for raw materials as substitutions.
We believe investors will need to be increasingly cognizant of the need to differentiate individual companies from a certain asset class, which may create unique opportunities for active managers to seek alpha for investors’ portfolios.
Conclusion: more regionalization, less globalization
Taking a step back, we believe that the decision among Asian countries to focus on “self-help” policies promoting growth is not only due to the China-U.S. trade war but is also symbolic of the myriad global challenges we face today. With possibilities ranging from a “no-deal” Brexit to emerging market contagion in South America, we envisage that countries will organize themselves more around the concept of regionalization than globalization. While this change will not occur overnight, we believe that it will be beneficial for fast-growing Asian economies and introduce new opportunities for alpha generation in Asian equities.
1 Office of the United States Representatives, as of August 23, 2019. On August 1, the Trump administration announced 10% on the remaining US$300 billion of Chinese imports to be imposed on September 1. The announcement was subsequently amended to defer tariffs on certain goods until December 15. On August 23, 2019, the Trump administration announced for the 25% tariffs on US$250 billion Chinese imports, the tariff rate will increase to 30%, effective October 1. For the 10% tariffs on US$300 billion Chinese imports, the tariffs will now be 15%. 2 Ministry of Finance of the People’s Republic of China and the Ministry of Commerce of the People’s Republic of China, as of September 5, 2019. On August 23, China announced it will apply additional tariffs of between 5-10% on US$75 billion of U.S. imports from September 1, 2019. 3 Deputy-level trade talks restarted in Washington in mid-September, high-level talks are expected on 10-11 October 2019. 4 Bloomberg, 5 September 2019. Both the NBS and Caixin manufacturing PMI were below the neutral threshold of ’50’- indicating economic contraction. 5 “Earnings surprises are for MSCI over a four-week time period,” Goldman Sachs, August 2019. 6 “China to cut VAT for manufacturing, construction sectors,” Reuters, March 5, 2019. 7 “China set to cut rates for middle classes in bid to stimulate consumption,” South China Morning Post, June 19, 2018. 8 “China seeks to boost car, electronics sales as economy slows,” Bloomberg, June 6, 2019. 9 China trims lending rates with new benchmark, more cuts expected,” Reuters, August 20, 2019. 10 “China issues 5G licenses in timely boost for Huawei,” Reuters, June 6, 2019. 11 Federal Reserve Bank of Richmond, Spring 1997. 12 Nomura, August 2019. 13 “Indonesia president proposes to move capital to Borneo,” Reuters, August 16, 2019. 14 IMF World Economic Outlook April 2019 and Nomura, August 2019. Note: chart displays the general government fiscal deficit (% of GDP) and general government gross debt (% of GDP) in 2019. 15 “India aims to woo foreign funds, revive growth from 5-Year low”, Bloomberg, August 23, 2019.
Important disclosures
Investing involves risks, including the potential loss of principal. Financial markets are volatile and can fluctuate significantly in response to company, industry, political, regulatory, market, or economic developments. These risks are magnified for investments made in emerging markets. Currency risk is the risk that fluctuations in exchange rates may adversely affect the value of a portfolio’s investments.
The information provided does not take into account the suitability, investment objectives, financial situation, or particular needs of any specific person. You should consider the suitability of any type of investment for your circumstances and, if necessary, seek professional advice.
This material, intended for the exclusive use by the recipients who are allowable to receive this document under the applicable laws and regulations of the relevant jurisdictions, was produced by, and the opinions expressed are those of, Manulife Investment Management as of the date of this publication, and are subject to change based on market and other conditions. The information and/or analysis contained in this material have been compiled or arrived at from sources believed to be reliable, but Manulife Investment Management does not make any representation as to their accuracy, correctness, usefulness, or completeness and does not accept liability for any loss arising from the use of the information and/or analysis contained. The information in this material may contain projections or other forward-looking statements regarding future events, targets, management discipline, or other expectations, and is only as current as of the date indicated. The information in this document, including statements concerning financial market trends, are based on current market conditions, which will fluctuate and may be superseded by subsequent market events or for other reasons. Manulife Investment Management disclaims any responsibility to update such information.
Neither Manulife Investment Management or its affiliates, nor any of their directors, officers or employees shall assume any liability or responsibility for any direct or indirect loss or damage or any other consequence of any person acting or not acting in reliance on the information contained herein. All overviews and commentary are intended to be general in nature and for current interest. While helpful, these overviews are no substitute for professional tax, investment or legal advice. Clients should seek professional advice for their particular situation. Neither Manulife, Manulife Investment Management, nor any of their affiliates or representatives is providing tax, investment or legal advice. Past performance does not guarantee future results. This material was prepared solely for informational purposes, does not constitute a recommendation, professional advice, an offer or an invitation by or on behalf of Manulife Investment Management to any person to buy or sell any security or adopt any investment strategy, and is no indication of trading intent in any fund or account managed by Manulife Investment Management. No investment strategy or risk management technique can guarantee returns or eliminate risk in any market environment. Diversification or asset allocation does not guarantee a profit nor protect against loss in any market. Unless otherwise specified, all data is sourced from Manulife Investment Management.
Manulife Investment Management
Manulife Investment Management is the global wealth and asset management segment of Manulife Financial Corporation. We draw on more than 150 years of financial stewardship to partner with clients across our institutional, retail, and retirement businesses globally. Our specialist approach to money management includes the highly differentiated strategies of our fixed-income, specialized equity, multi-asset solutions, and private markets teams—along with access to specialized, unaffiliated asset managers from around the world through our multimanager model.
These materials have not been reviewed by, are not registered with any securities or other regulatory authority, and may, where appropriate, be distributed by the following Manulife entities in their respective jurisdictions. Additional information about Manulife Investment Management may be found at www.manulifeim.com/institutional.
Australia: Hancock Natural Resource Group Australasia Pty Limited, Manulife Investment Management (Hong Kong) Limited. Brazil: Hancock Asset Management Brasil Ltda. Canada: Manulife Investment Management Limited, Manulife Investment Management Distributors Inc., Manulife Investment Management (North America) Limited, Manulife Investment Management Private Markets (Canada) Corp. China: Manulife Overseas Investment Fund Management (Shanghai) Limited Company. European Economic Area and United Kingdom: Manulife Investment Management (Europe) Ltd. which is authorised and regulated by the Financial Conduct Authority, Manulife Investment Management (Ireland) Ltd. which is authorised and regulated by the Central Bank of Ireland Hong Kong: Manulife Investment Management (Hong Kong) Limited. Indonesia: PT Manulife Aset Manajemen Indonesia. Japan: Manulife Asset Management (Japan) Limited. Malaysia: Manulife Investment Management (M) Berhad (formerly known as Manulife Asset Management Services Berhad) 200801033087 (834424-U) Philippines: Manulife Asset Management and Trust Corporation. Singapore: Manulife Investment Management (Singapore) Pte. Ltd. (Company Registration No. 200709952G) Switzerland: Manulife IM (Switzerland) LLC. Taiwan: Manulife Investment Management (Taiwan) Co. Ltd. Thailand: Manulife Asset Management (Thailand) Company Limited. United States: John Hancock Investment Management LLC, Manulife Investment Management (US) LLC, Hancock Capital Investment Management, LLC and Hancock Natural Resource Group, Inc. Vietnam: Manulife Investment Fund Management (Vietnam) Company Limited.
500321

